Figure 7.
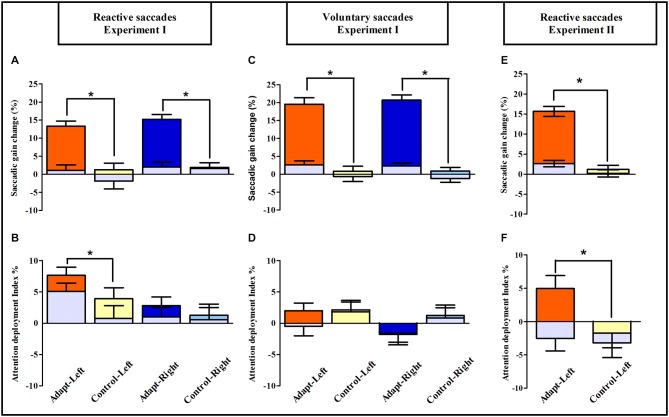
Saccadic adaptation boosts pure covert attention: summary of oculomotor and visuo-attentional performance in Experiments I and II. Upper row: saccadic gain changes between pre- and post-exposure are plotted separately for the Adapt-Left group (orange), Control-Left group (yellow), Adapt-Right group (blue) and Control-Right group (light blue) in the reactive (A) and voluntary conditions (C) of Experiment I and in the reactive condition of Experiment II (E); gray bars represent the unexposed hemi-field in all groups. Asterisks indicate significant differences between the adaptation and control groups for the exposed hemi-fields (post hoc LSD tests, all p < 0.0001). Error bars indicate ±1 SEM. Lower row: the mean attention deployment index averaged across target positions is plotted separately for the Adapt-Left group (orange), Control-Left group (yellow), Adapt-Right group (blue) and Control-Right group (light blue) in the reactive (B) and the voluntary conditions (D) of Experiment I and in the reactive condition of Experiment II (F); gray bars represent the unexposed hemi-field. Asterisks denote significant differences between adaptation and control groups (post hoc LSD tests, all p < 0.05). Error bars indicate ±1 SEM.

