
Fig. 2.
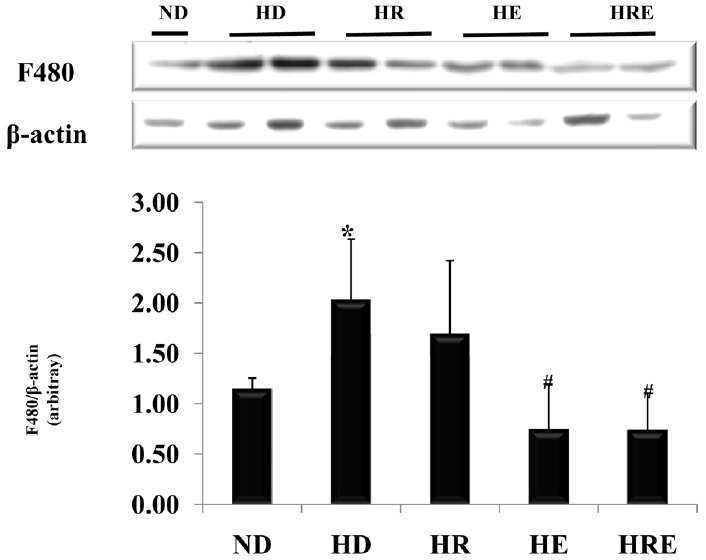
Expression of the macrophage marker, F480, in liver of high fat diet mice. All values are expressed as means±SD. P-values are the result of post hoc LSD test when the one-way ANOVA was significant. ND: normal diet; HD: high fat diet; HR: high fat diet with resveratrol; HE: high fat diet with exercise; HRE: high fat diet with resveratrol+exercise. * p < .05 different from the ND group, +p < .05 different from the HD group.