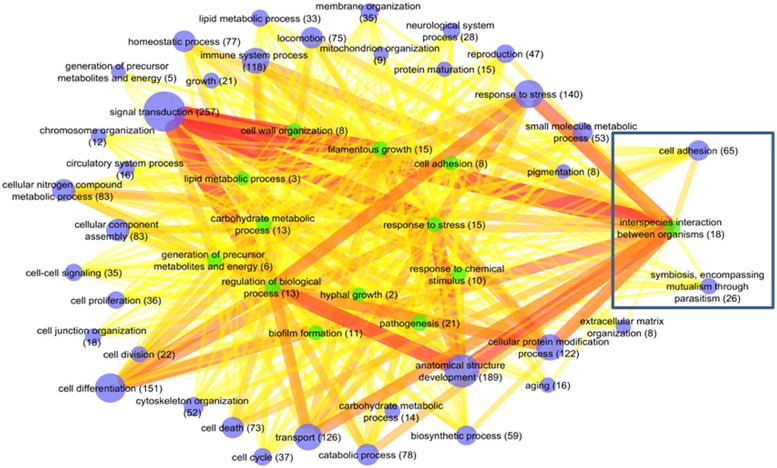
FIGURE 5.
Mus musculus–C. albicans network of functional GO terms. Nodes represent GO slim terms and edges depict interactions between host and fungal genes belonging to the particular GO slim terms. The node size denotes the number of genes in each GO slim term. The edge width and edge color correspond to the number of interactions between the connected nodes from thin/yellow to thick/red representing low to high interaction degrees. Fungal GO slim terms are visualized by green nodes and murine GO slim terms by blue nodes. The top 10% fungal pathogen interactors with the most interactions were removed from the network visualization to improve readability of the figure. The box shows the subnetworks that are evaluated in more detail.

