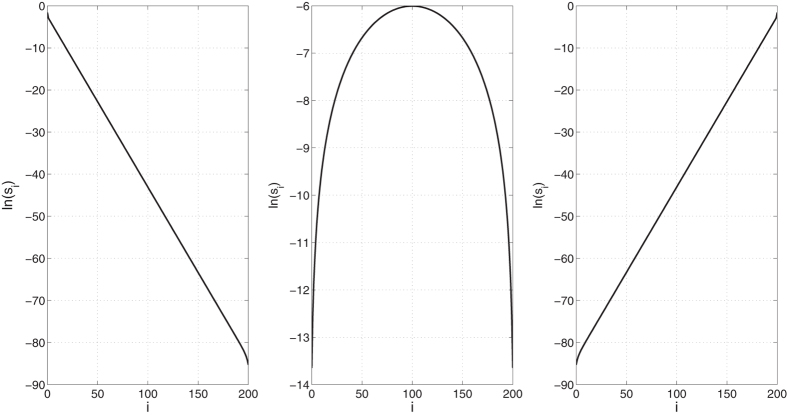
Figure 2. ln(si) as a function of i in three HRFMs with length n = 200. Left: λ0 = 0.4 and λ200 = 1.
Here λ0 is rate limiting and thus the sensitivities of sites close to site 1 are larger. Note that ln(si) decays linearly with i. Middle: λ0 = λ200 = 1. Here the maximal sensitivity is with respect to λn/2 and it decreases as we move towards the edges of the chain. Right: λ0 = 1 and λ200 = 0.4.

