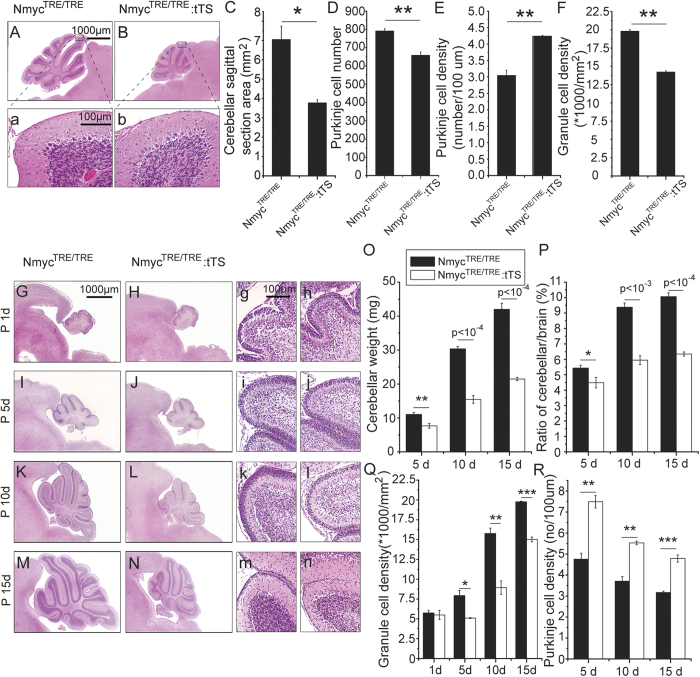
Figure 1. Silencing N-myc expression severely disrupts postnatal cerebellar development.
(A, a) HE staining of cerebellum sagittal section from TRE mice. (B, b) HE staining of cerebellum sagittal section from tTS mice. (C) The difference in cerebellar sagittal section area size between tTS and TRE mice. (D) The difference in Purkinje cell number between tTS and TRE mice. (E) The difference in Purkinje cell density between tTS and TRE mice. (F) The difference in granule cell density between tTS and TRE mice. (G–N) The cerebellar development stages of tTS and TRE mice from postnatal 1 d to 15 d. (O–R) Analysis of cerebellar weight, cerebellum/brain ratio, granule cell density and the Purkinje cell density between tTS and TRE mice at postnatal 5 d, 10 d, 15 d (n = 5). ***p < 0.001; **p < 0.01; *p < 0.05.

