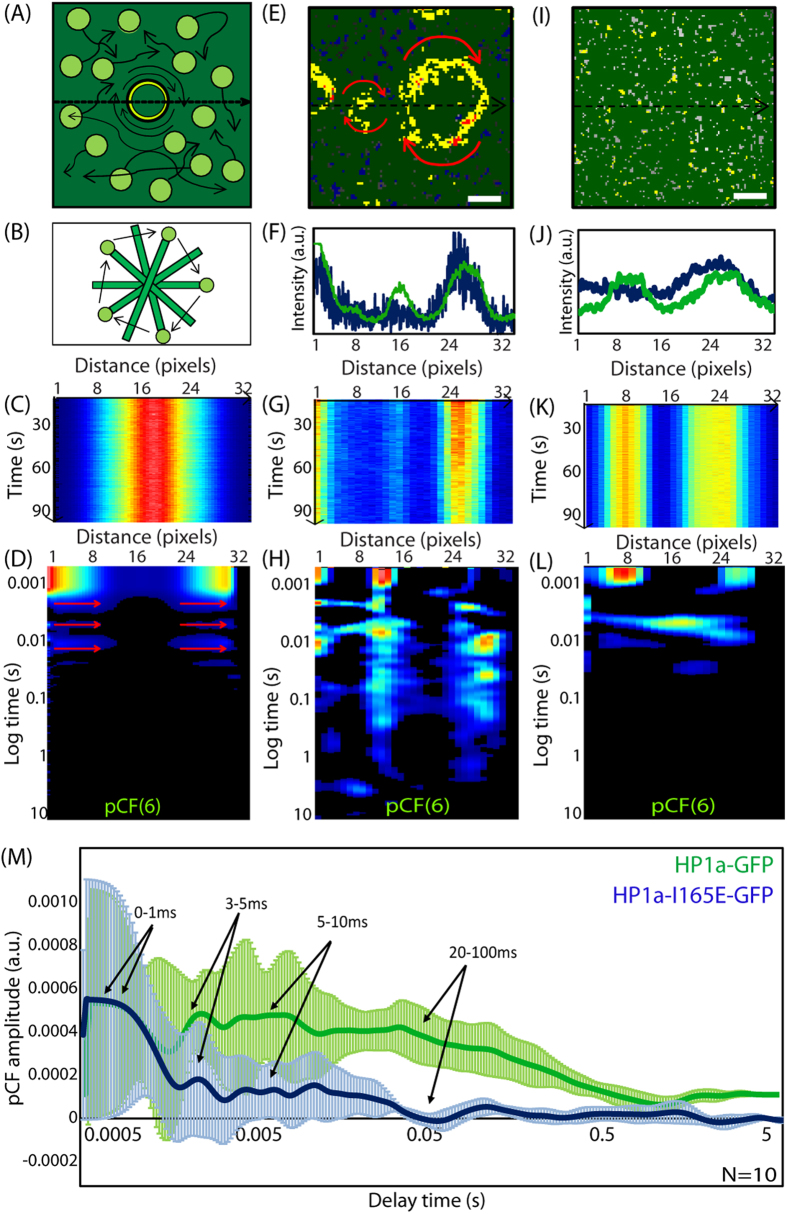
Figure 3. HP1-α heterochromatin foci rotate at different turn rates that are dependent on dimerization.
(A) In vivo data suggests HP1-α to be bound to the edges of the heterochromatin foci as a dimer and foci to rotate with a characteristic time. (B) We simulate the rotating heterochromatin foci with a dimer periphery as a rotating stick with a fluorescent molecule on one end. (C) A simulated line scan acquired across the rotating stick results in a ‘heterochromatin foci’ between pixels 12–20. (D) Pair correlation analysis along the simulation line scan results in the multiple bands of correlation only at the ends of the simulated heterochromatin foci. (E) Brightness analysis of HP1-α dimerization around periphery of heterochromatin foci. (F) Intensity profile of free EGFP overlaid with the intensity profile of Hoechst 33342. (G) Line scan acquired along the region of interest in the HP1-α-EGFP channel reveals a co-localisation with the heterochromatin regions. (H) Pair correlation analysis of HP1-α-EGFP molecular flow reveals multiple bands of correlation at the edges of the foci. (I) Brightness analysis of HP1-α-I165E reveals loss of dimerization around periphery of heterochromatin foci. (J) Intensity profile of HP1-α-I165E-EGFP overlaid with the intensity profile of Hoechst 33342. (K) Line scan acquired along the region of interest in the HP1-α-I165E-EGFP channel reveals a co-localisation with the heterochromatin regions. (L) Pair correlation analysis of HP1-α-I165E-EGFP molecular flow reveals a loss of the long time scale bands of correlation at the edges of the foci. (M) Overlay of the average pair correlation profile for HP1-α-EGFP molecular flow (N = 10 cells) and HP1-α-I165E-EGFP molecular flow (N = 10 cells) in regions of heterochromatin foci, reveals the re-appearance of molecules on a timescale of 20–100 ms to be lost upon inhibition of dimerization.

