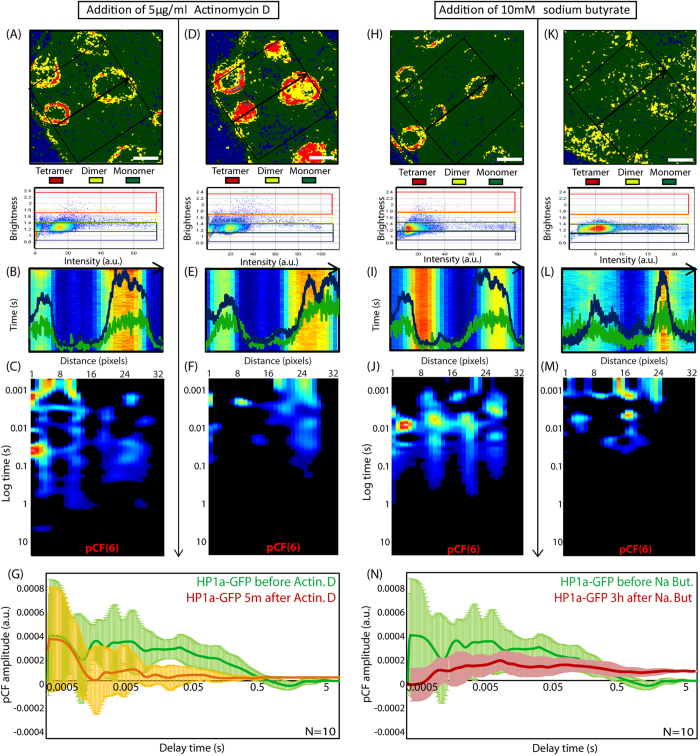
Figure 4. Induction of chromatin compaction or loosening by drug treatment disrupts HP1-α oligomerization and molecular flow in both cases.
(A) Brightness analysis of HP1-α dimerization around periphery of heterochromatin foci. (B) Intensity profile of free EGFP and Hoechst 33342 superimposed over the line scan acquired across the heterochromatin foci in (A). (C) Pair correlation analysis of HP1-α-EGFP molecular flow reveals the multiple bands of correlation observed in Figs 2 and 3, at the edges of the foci. (D) Brightness analysis of HP1-α after treatment with Actinomycin D reveals HP1α to further oligomerize into a tetrameric form around the periphery of the heterochromatin foci. (E) Intensity profile of free EGFP and Hoechst 33342 superimposed over the line scan acquired across the heterochromatin foci in (D). (F) Pair correlation analysis of HP1-α-EGFP molecular flow after Actinomycin D treatment reveals the multiple bands of correlation observed in (C) to be disrupted. (G) Overlay of the average pair correlation profile for HP1-α-EGFP molecular flow before and after treatment with Actinomycrin D (N = 10 heterochromatin foci) reveals the re-appearance of molecules on a time scale of 20–100 ms to be inhibited. (H) Brightness analysis of HP1-α dimerization around periphery of heterochromatin foci. (I) Intensity profile of free EGFP and Hoechst 33342 superimposed over the line scan acquired across the heterochromatin foci in (H). (J) Pair correlation analysis of HP1-α-EGFP molecular flow reveals the multiple bands of correlation observed in Figs 2 and 3, at the edges of the foci. (K) Brightness analysis of HP1-α after treatment with Sodium Butyrate reveals HP1α oligomerization around the heterochromatin foci to be inhibited. (L) Intensity profile of free EGFP and Hoechst 33342 superimposed over the line scan acquired across the heterochromatin foci in (K). (M) Pair correlation analysis of HP1-α-EGFP molecular flow after treatment with sodium butyrate reveals the multiple bands of correlation in (L) to be disrupted. (N) Overlay of the average pair correlation profile for HP1-α-EGFP molecular flow before and after treatment with Sodium Butyrate (N = 10 heterochromatin foci) reveals the re-appearance of molecules on a time scale of 5–10 ms to be inhibited.

