
Figure 3. Localization responses in auditory-only trials as a function of the number of consecutive preceding audiovisual (AV) trials with the same or different sound frequency.
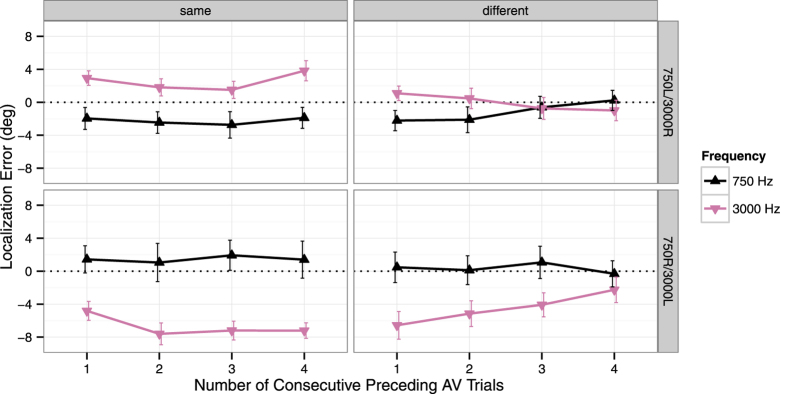
Mean constant errors (i.e., the mean deviation of the spatial responses from the location of the sound source) across all loudspeaker locations are shown separately for the 750 Hz and 3000 Hz tones. Upper panels show the data for the subgroup of participants (n = 15) in which the 750 Hz tone was paired with a visual stimulus to the left and the 3000 Hz tone with a visual stimulus to the right (750L/3000R). Data for the subgroup of participants (n = 15) in which the 750 Hz tone was paired with a visual stimulus to the right and the 3000 Hz tone with a visual stimulus to the left (750R/3000L) are shown in the lower panels. Negative values indicate constant errors to the left of the true stimulus location, and positive values indicate constant errors to the right. Error bars denote the SEM.