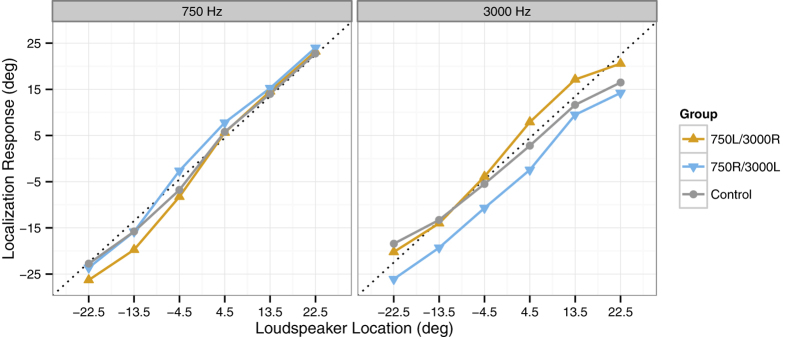
Figure 4. Mean localization responses per loudspeaker location in auditory-only test trials.

Localization responses are shown separately for the two experimental groups 750L/3000R (orange) and 750R/3000L (blue), in comparison to a naïve control group (grey) that performed only the unisensory localization task without any audiovisual adaptation. The left panel shows the localization data for the 750 Hz tone, and the right panel shows the localization data for the 3000 Hz tone. Dotted lines indicate the actual locations of the loudspeakers.
