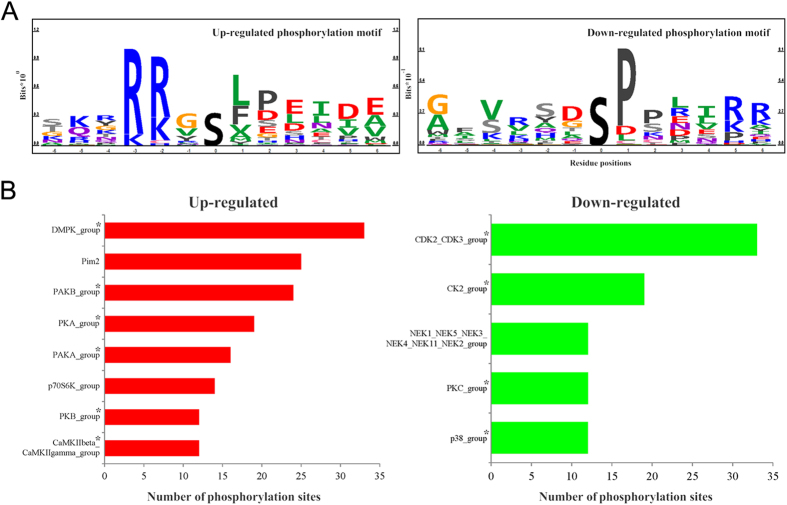
Figure 4. Systems level analysis of phosphorylation in mpkDCT cells.
(A) Information based sequence logo of the up- and down-regulated phosphorylation motifs following dDAVP stimulation of mpkDCT cells. (B) Regulated kinases in mpkDCT cells determined using NetworKIN. The predicted up or down-regulated kinases are shown based on regulated phosphorylation sites. The length of the bars indicates the numbers of predicted phosphorylation sites. *indicates kinase group members identified using LC-MS/MS in this study.

