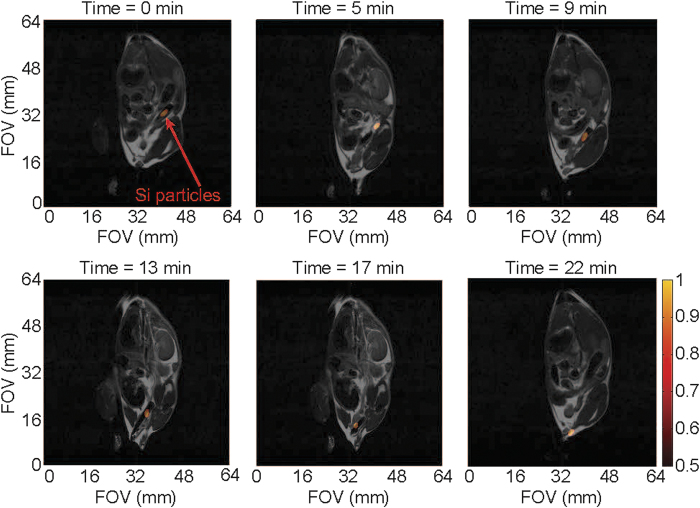
Figure 3. Co-registered 29Si/1H MRI-tracking in vivo.
Transit of angiocatheter through the large intestines of a live normal mouse using alternating 29Si/1H scans, showing changes in mouse anatomy with movement of the catheter. Absolute 29Si signal intensities are denoted in arbitrary units on the colored scale; greyscale denotes 1H intensities. Pertinent imaging parameters, as well as Supplemental Video S3 (showing a time-lapse video of the catheter tracking in Fig. 3), are included in the Supplementary Materials.

