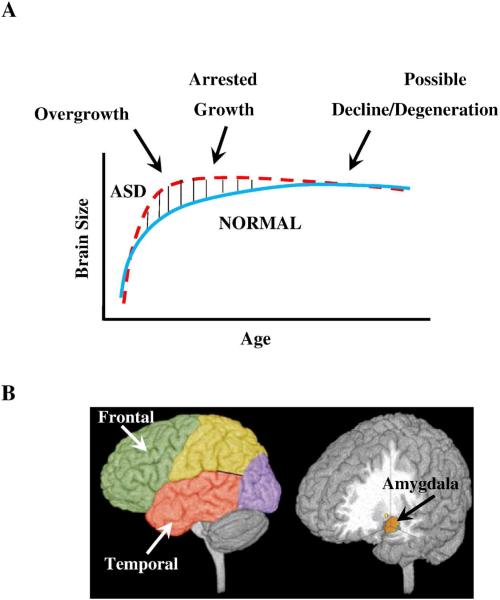
Figure 2. Three phases of growth pathology in autism.
(A) Model of early brain overgrowth in autism that is followed by arrest of growth. Red line represents ASD, while blue line represents age-matched typically developing individuals. In some regions and individuals, the arrest of growth may be followed by degeneration, indicated by the red dashes that slope slightly downward. (B) Sites of regional overgrowth in ASD include frontal and temporal cortices and amygdala (Reproduced from: Brain growth across the life-span in autism: age specific changes in anatomic pathology; Courchesne, Campbell and Solso, Brain Research 1380 (2011)138–145, with permission from Elsevier B.V.)

