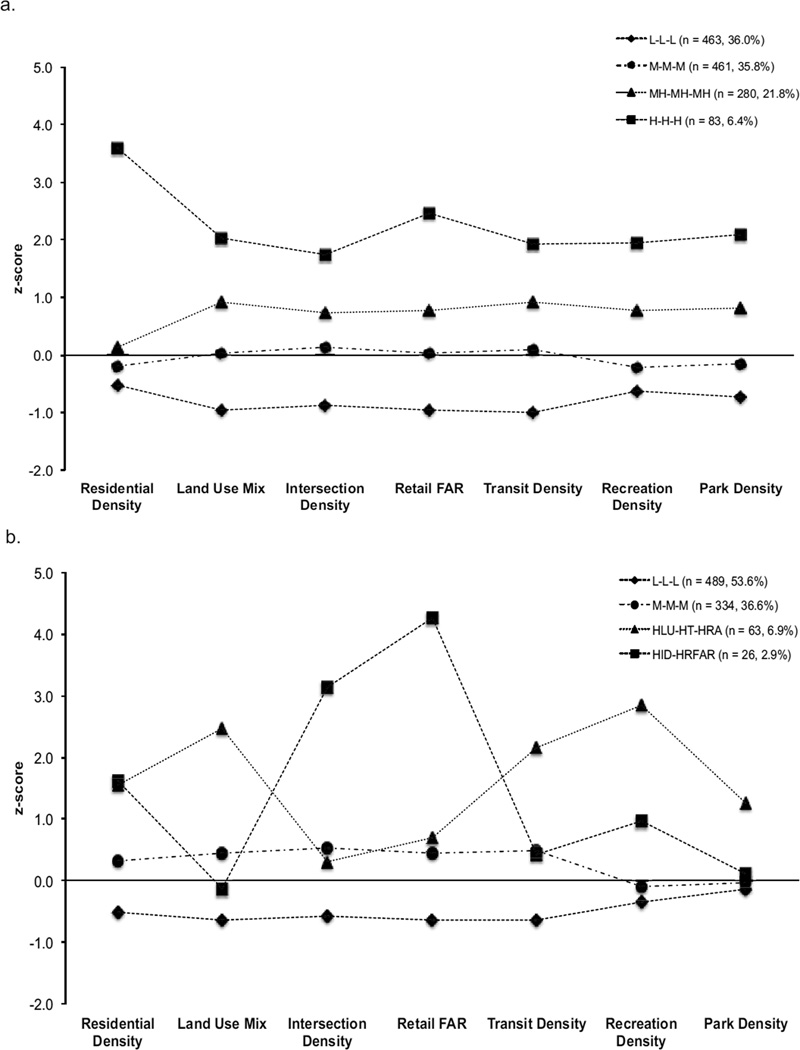
Figure 1.
A. Four latent profile derived neighborhood patterns for the Seattle-King County, WA region.
B. Four latent profile derived neighborhood patterns for the Baltimore, MD/Washington DC region.
A z-score equal to ± 1 reflects an indicator value ± 1 standard deviations from the average value of that indicator in the region. L-L-L = low walkability, low transit access, and low recreation access. M-M-M = medium levels of walkability, transit access, and recreation access. MH-MH-MH = moderately high levels of walkability, transit access, and recreation access. H-H-H= high levels of walkability, transit access, and recreation access. HLU-HT-HRA = high land use mix, high transit access, and high recreation access. HID-HRFAR = very high intersection density and retail floor area ratio.

