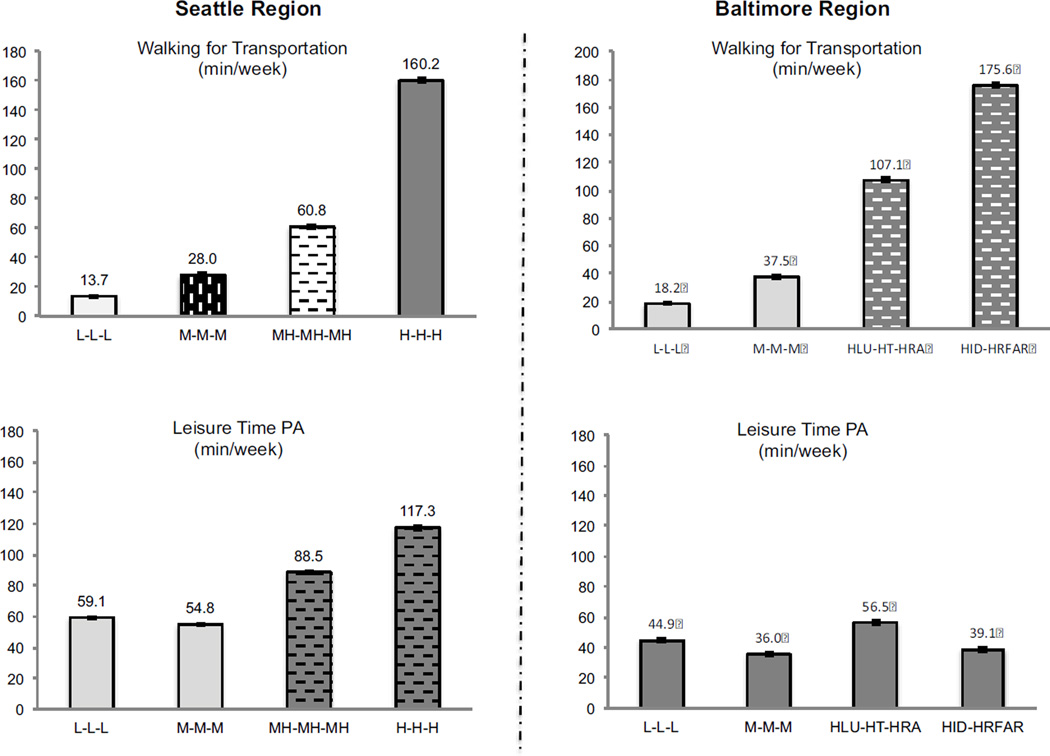
Figure 3.
Latent profiles and self-reported physical activity in Seattle, WA and Baltimore, MD/Washington, DC regions.
1Walking for transportation and leisure time PA adjusted for sex, age, race/ethnicity, annual household income, educational attainment, number of motor vehicles and eligible drivers in household, marital or cohabitation status, number of people in household, and years at current address.
2Within each panel, non-significant comparisons are reflected across profiles by bars with matching colors or matching patterns. Values reflect anti-logged model-adjusted means and standard error bars.

