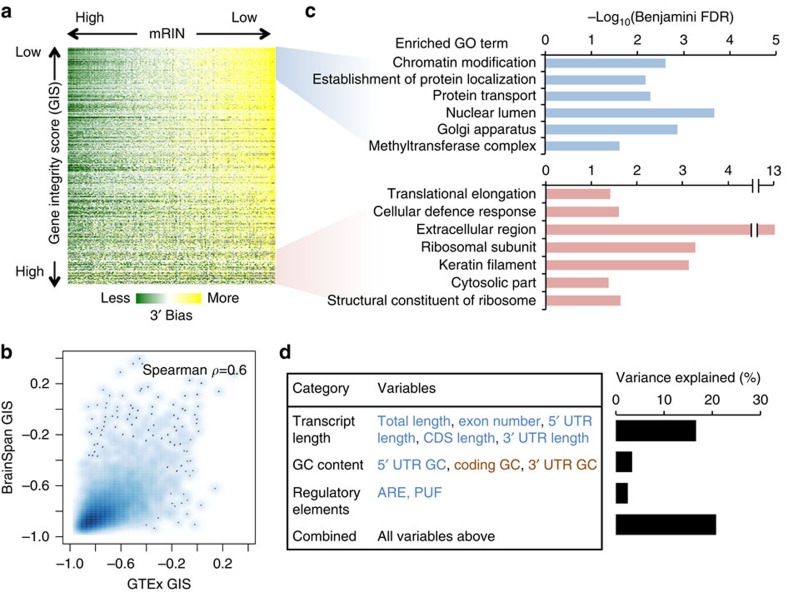
Figure 5. Gene-specific degradation and their functional and transcript structural features.
(a) Visualization of the mKS matrix with samples ordered by mRIN and genes ordered by a gene instability score (GIS) defined as the correlation between mRIN and mKS across samples. (b) Smooth scatter plot of GIS estimated from the GTEx and BrainSpan data sets, respectively. Areas in darker blue represent a higher density of genes. (c) Gene ontology (GO) analysis of genes with the lowest or highest GIS. Only representative GO terms with Benjamini FDR <0.05 are shown (see Supplementary Data 4 and 5 for a complete list). (d) Linear regression analysis of GIS using different groups of features reflecting transcript length, base composition and regulatory sequences. Individual variables showing positive or negative correlation with transcript stability are indicated in red and blue, respectively. Variance explained by each regression model including a specific subset of variables is shown in the bar plot.

