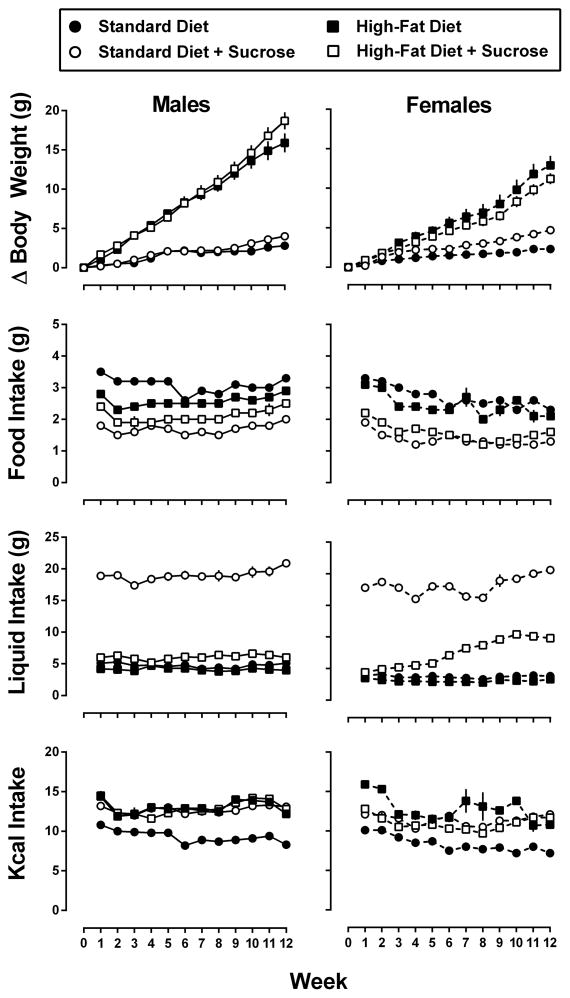
Figure 2.
Changes in body weight, food intake, liquid intake, and kcal consumption for male (left panels) and female (right panels) mice consuming one of four experimental diets: standard chow (filled circles), standard chow + 10% sucrose (open circles), high-fat chow (filled squares), or high-fat chow + 10% sucrose (open squares) over the 12 weeks of the study. Data for change in body weight (g) represent the mean ± SEM, n=8 mice/group, however, because mice were group housed, intake data represent the mean ± SEM intake of food (g), liquid (g), or kcals, n=3 cages per group.

