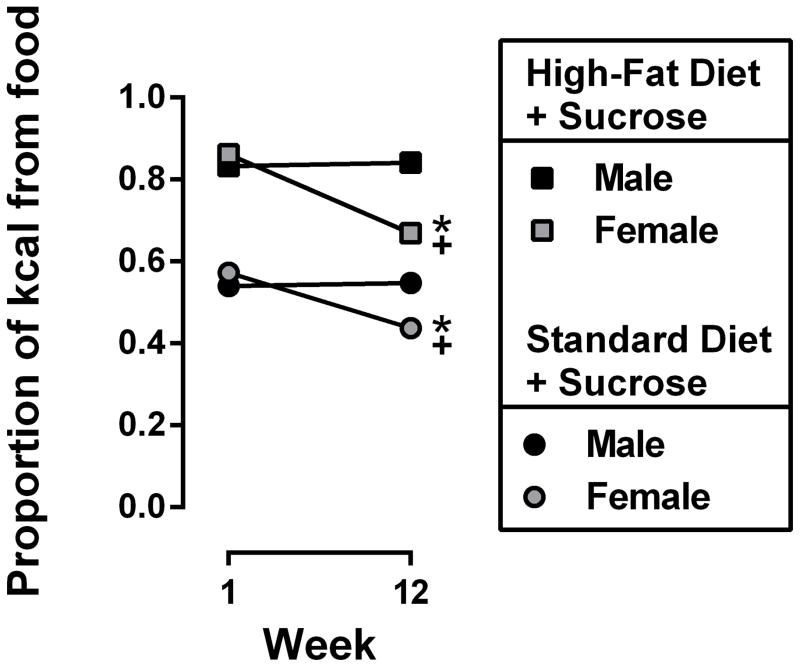
Figure 3.
Proportion of calories that were obtained from food, relative to sucrose, for male (black symbols) and female (gray symbols) mice consuming either standard chow + 10% sucrose (circles), or high-fat chow + 10% sucrose (squares). Data represent the mean proportion of calories from food ± SEM, n=3 cages per group, during week 1 and week 12. *, p<0.05; significant difference between week 1 and week 12 (within group) as determined by paired, two-tailed t-tests. +, p<0.05; significant difference between male and female mice (within diet) at week 1 or week 12 as determined by unpaired, two-tailed t-tests.

