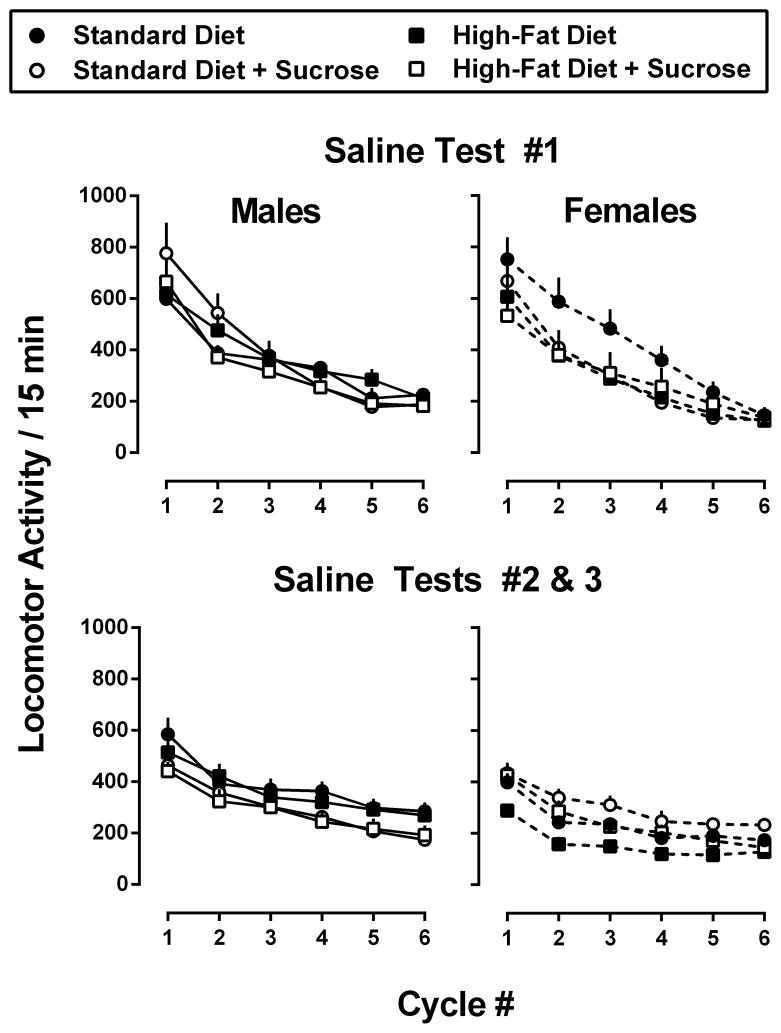
Figure 4.
Total locomotor activity following saline injections in male (left panels) and female (right panels) mice consuming one of four experimental diets: standard chow (filled circles), standard chow + 10% sucrose (open circles), high-fat chow (filled squares), or high-fat chow + 10% sucrose (open squares). Top panels show locomotor activity from the pre-cocaine saline test (week 3), whereas bottom panels show locomotor activity from post-cocaine tests (weeks 8 and 11). Data represent the mean number of photobeam breaks ± SEM, n=8 mice per group during each 15-min cycle.

