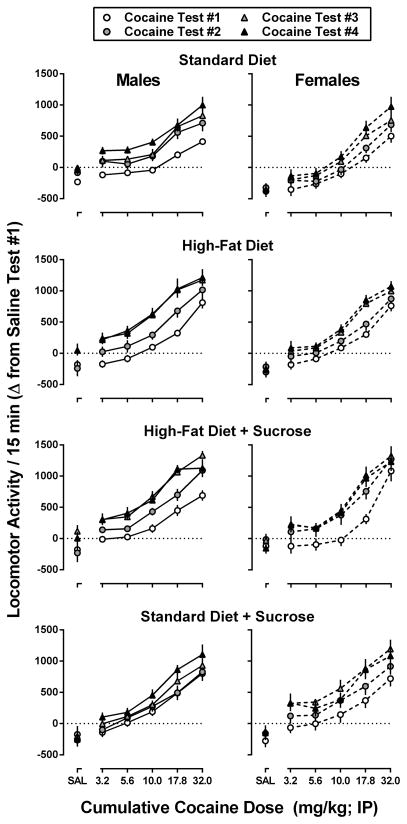
Figure 5.
Dose-response curves for cocaine-induced locomotor activity in male (left panels) and female (right panels) mice consuming one of four experimental diets: standard chow, standard chow + 10% sucrose, high-fat chow, or high-fat chow + 10% sucrose during each of four weekly tests. Data represent the mean ± SEM, n=8 mice per group, difference in the total locomotor activity observed during the 15-min period following saline and each cumulative dose of cocaine (3.2, 5.6, 10.0, 17.8, and 32.0 mg/kg) relative to the total locomotor activity counts observed during the corresponding cycle during saline test #1.

