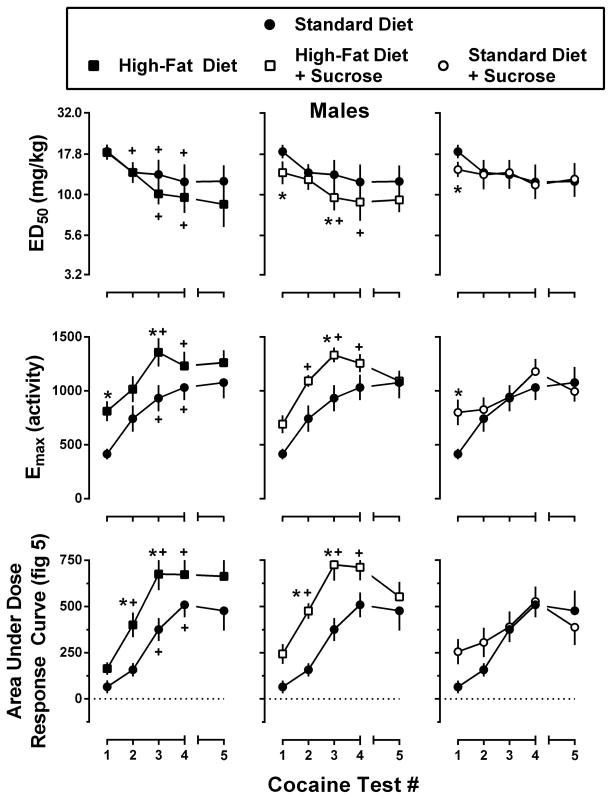
Figure 6.
Potency (top row) and effectiveness (middle row) of cocaine to increase locomotor activity in male mice consuming one of four experimental diets: standard chow (filled circles), standard chow + 10% sucrose (open circles), high-fat chow (filled squares), or high-fat chow + 10% sucrose (open squares). Potency data represent the mean ± 95% CI, n=8 mice per group, of the dose required to produce 50% of the maximal locomotor response during each of the five cocaine tests. Effectiveness data represent the mean ± SEM, n=8, of the maximal locomotor response during each of the five cocaine tests. Area under dose-response curve (AUC) data (bottom row) represent the mean ± SEM, n=8, of the AUC for cocaine tests #1–5 (3.2–32.0 mg/kg cocaine; Figure 5). Data from Standard Diet mice are re-plotted on each panel for comparison. *, p<0.05; significant difference from Standard Diet mice as determined by two-way repeated measures ANOVA with post-hoc Holm-Sidak’s tests. +, p<0.05; significant difference from cocaine test #1 as determined by one-way repeated measures ANOVA with post-hoc Dunnett’s tests.

