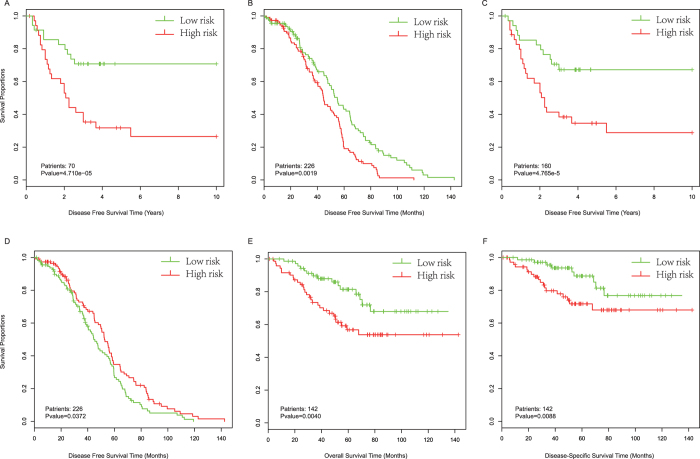
Figure 6. Kaplan-Meier estimates of the overall survival, disease free survival (DFS), or disease-specific survival (DSS) of GEO patients using epigenome-based marker genes.
Patients were split into two groups based on their risk scores defines by marker genes. (A) Kaplan-Meier curves for GSE24551 stage 3 patients, based on marker genes coupled by top-ranked CRC DMRs. (B) Kaplan-Meier curves for GSE14333 patients as validation of the CRC marker genes. (C) Kaplan-Meier curves for GSE24551 stage 3 patients, based on marker genes coupled by top-ranked COAD DMRs. (D) Kaplan-Meier curves for the GSE14333 data set as a validation of marker genes from COAD. Kaplan-Meier curves for overall survival (E) and DSS (F) of GSE17536 patients, based on marker genes from COAD. Patient numbers and the significant p values are marked in the left corner. The differences between the two curves were determined by two-sided log-rank tests. The tick marks on the Kaplan-Meier curves indicate the censored subjects.

