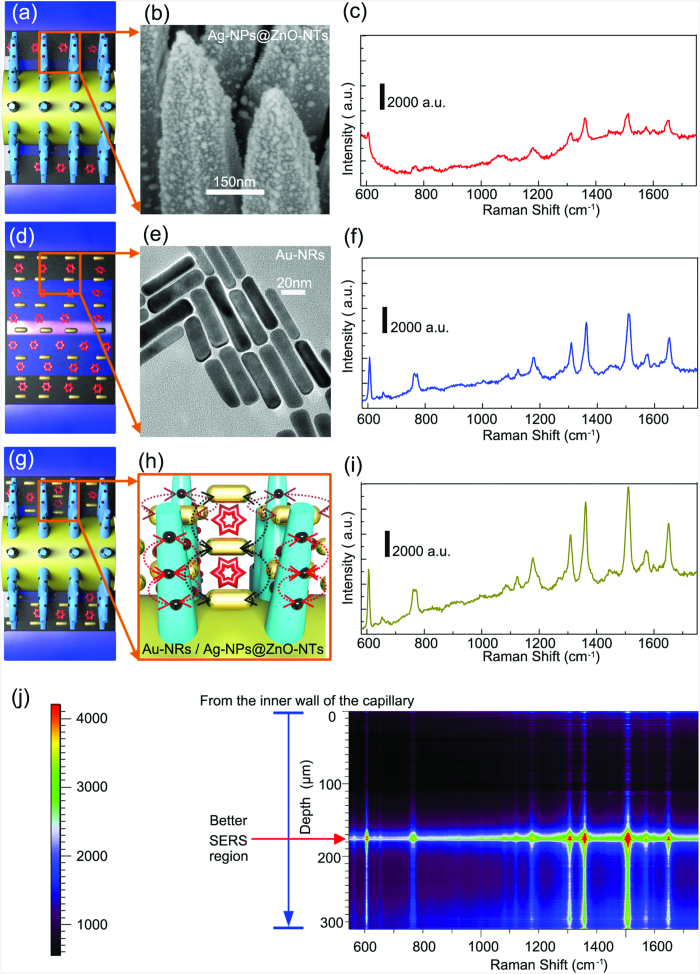
Figure 2. SERS spectra on different nano-building blocks.
(a,b) Schematic of the Ag-NPs@ZnO-NTs@constantan-wire inside of a glass capillary surrounded by R6G solution and the corresponding SEM image of the Ag-NPs@ZnO-NTs covered on the constantan-wire, (c) SERS activity on the substrate shown in (a); (d,e) Schematic of a mixture of Au-NRs and R6G in a glass capillary and the corresponding TEM image of the Au-NRs, (f) SERS activity on the substrate shown in (d); (g,h) Schematic of the Ag-NPs@ZnO-NTs@constantan-wire inside of a glass capillary surrounded by mixture of Au-NRs and R6G, (i) SERS activity on the substrate shown in (g), SERS acquisition time: 30 s; (j) The depth SERS mapping was accompanied by adjusting the focus of incident light from inner wall of the capillary and 300 μm down. The depth SERS mapping was acquired with an integration time of 2 s. This figure was drawn by one of the coauthors (Qitao Zhou).

