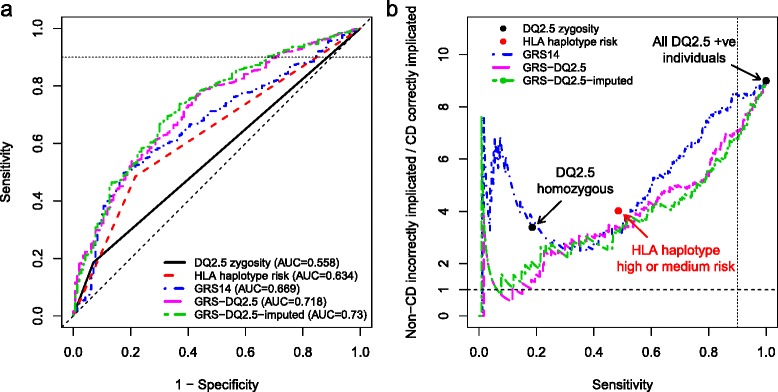
Fig. 3.

External validation results on the DQ2.5+ individuals in the North American dataset. a ROC curves for case/control prediction and b non-CD implicated per CD correctly implicated, ((1 – PPV)/PPV, equivalent to 1/(post-test-odds of disease)) versus sensitivity, for models developed on the European data and tested on the DQ2.5+ subset of the North American cohort. The DQ2.5 zygosity is the number of DQ2.5 alleles for each individual (heterozygous = 1, homozygous = 2). We assumed a CD prevalence of 10 % in the DQ2.5+, corresponding to a baseline implication ratio of 9:1, that is, all DQ2.5+ implicated as having CD at 100 % sensitivity
