
Fig. 4.
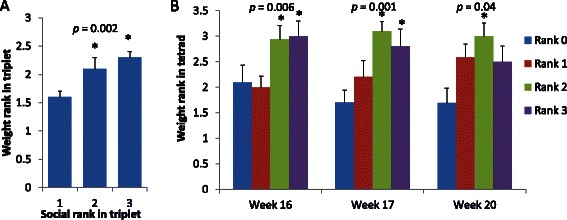
Weight ranks of mice with different social rank in triads of littermates on postnatal week 11 (a) and in tetrads composed of animals from different exposure groups on weeks 16, 17 and 20 (b). The smaller value of social rank indicate more dominant status, smaller value of weight rank indicate lighter animal. All p-values are for Spearman correlation, asterisks indicate significant difference (T-test p < 0.05) with dominant animals