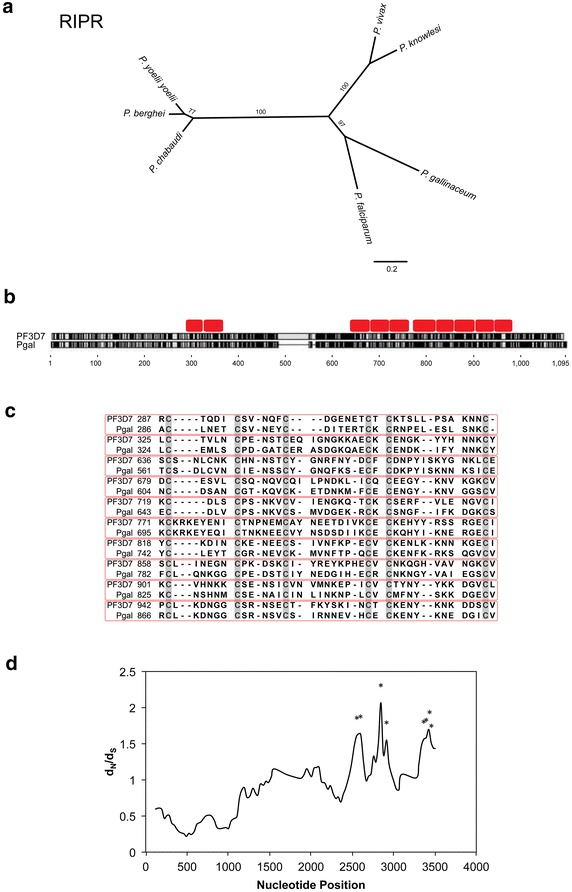
Fig. 3.

Comparison of Plasmodium rip. a Phylogeny of the Plasmodium based on amino acid sequences of RIPR. b Schematic of P. falciparum and P. gallinaceum RIPR amino acid alignment. Conserved regions are represented by black blocks. Variable regions are represented by grey blocks. Gaps in the alignment are represented by horizontal black lines. Epidermal growth factor-like domains are represented by red blocks. c Alignment of P. falciparum and P. gallinaceum epidermal growth factor-like domains. Individual epidermal growth factor-like domains are outlined in red and are ordered according to location, with the domain located closest to the N-terminus positioned at the top and the domain located closest to the C-terminus positioned at the bottom of the alignment. d Sliding window plot of dN/dS of ripr. The window length is 180 bp with a step size of 90 bp. Asterisks indicate regions with a significant excess of non-synonymous substitutions (P ≤ 0.05).
