FIG 2.
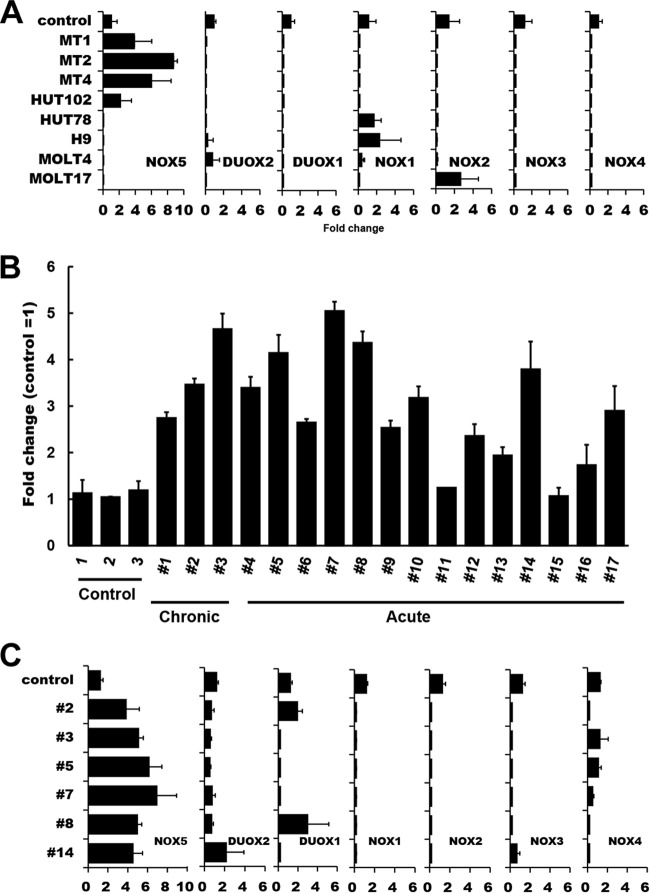
Analysis of Nox family expression in HTLV-1-infected T-cell lines and ATL PBMC. (A) Total RNAs were extracted from various HTLV-1-infected (MT1, MT2, MT4, and HUT102) and HTLV-1-uninfected (HUT78, H9, MOLT4, and MOLT17) T cells, and levels of mRNA expression of Nox family members were analyzed by real-time PCR. Control data represent normal T cells. One-way ANOVA was performed to determine differences between HTLV-1-infected and -uninfected cell lines. There was a statistically significant difference only in the Nox5 expression data (P < 0.05 versus control). (B) The levels of Nox5 mRNA expression in ATL primary cells (Table 1) were examined by real-time PCR. CTL (control), normal PBMC. The data represent means ± SD (n = 3) of results from three separate experiments. (C) Comparison of levels of Nox isoform expression in ATL patient samples. A total of 6 samples were randomly selected from 17 ATL patient samples which had been analyzed as described for panel B and subjected to the analysis of Nox isoform expression by real-time PCR. Control, normal PBMC. β-Actin was used as an internal control. The data represent means ± SD (n = 3) of results from three separate experiments. Note that, among the Nox family members, only the levels of Nox5 were increased in the 6 ATL patient samples examined.

