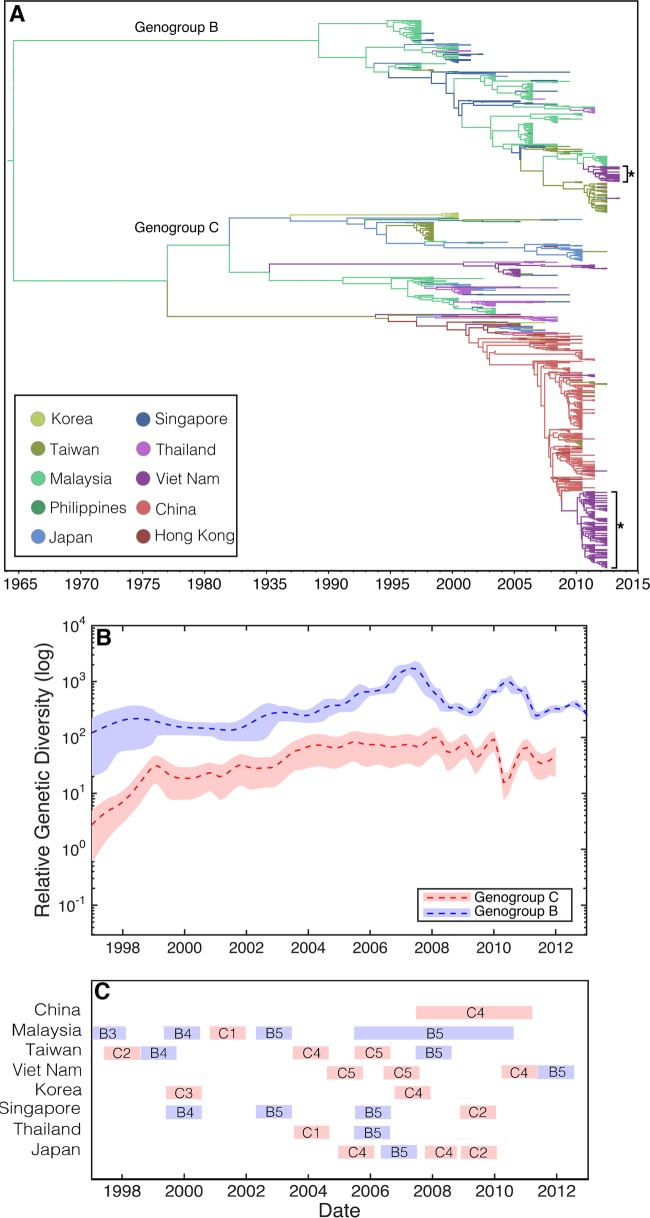
FIG 1.
(A) MCC tree of 1,176 complete VP1 sequences. The phylogeny includes 200 sequences from Viet Nam, as well as 976 randomly selected sequences from GenBank, sampled from 10 discrete locations in Southeast Asia (China, Hong Kong, Japan, South Korea, Malaysia, Philippines, Singapore, Taiwan, Thailand, and Viet Nam) between 1997 and 2013. Branches are color-coded according to the location of sampling. Asterisks indicate the two major subgenogroups from Viet Nam sampled in the present study. (B) Bayesian skyride plots, illustrating the relative genetic diversity of genogroups B (blue) and C (red) through time. A dashed line indicates the mean while shaded areas show the upper and lower 95% HPD values. (C) The temporal distribution of the different subgenogroups circulating in the region (partially adapted from Fig. 2.2 in reference 54). The data are from countries with enhanced surveillance since 1997.

