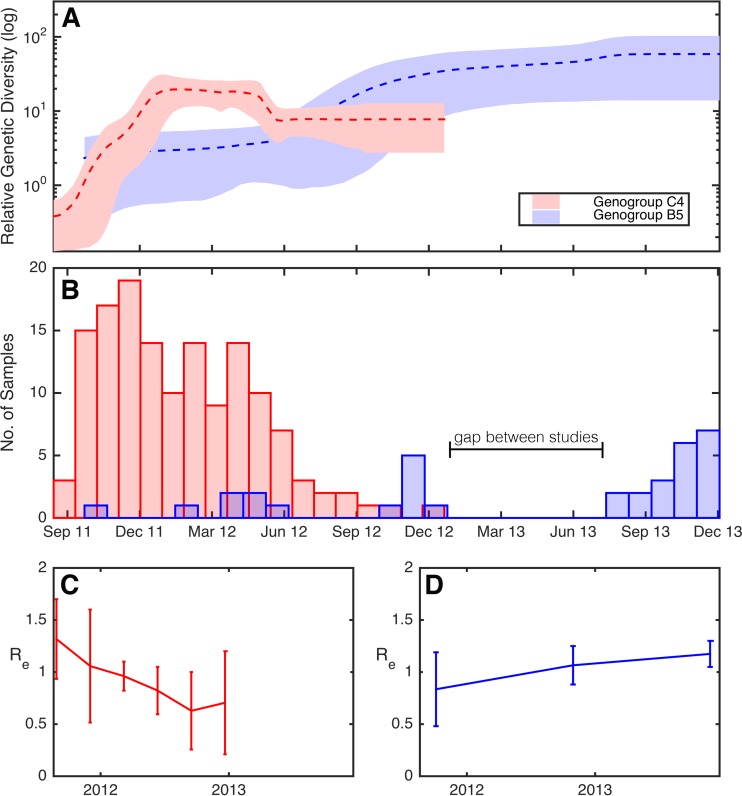
FIG 3.
(A) Bayesian skyride plots showing changing levels of relative genetic diversity over time of the two Viet Nam lineages indicated by asterisks in Fig. 1A. Two skyride plots are shown: one from subgenogroup B5 (blue), and the other from subgenogroup C4 (red). A dashed line indicates the mean while the shaded area shows the upper and lower 95% HPD values. (B) Sampling prevalence of subgenogroup C4 (red) and B5 (blue) over the study period. Changing values of Re over time for EV-A71 subgenogroups C4 (C) and B5 (D), estimated using a serial-sampled birth-death model. The line plot shows the median estimate of Re, while 95% HPD values are given by error bars.

