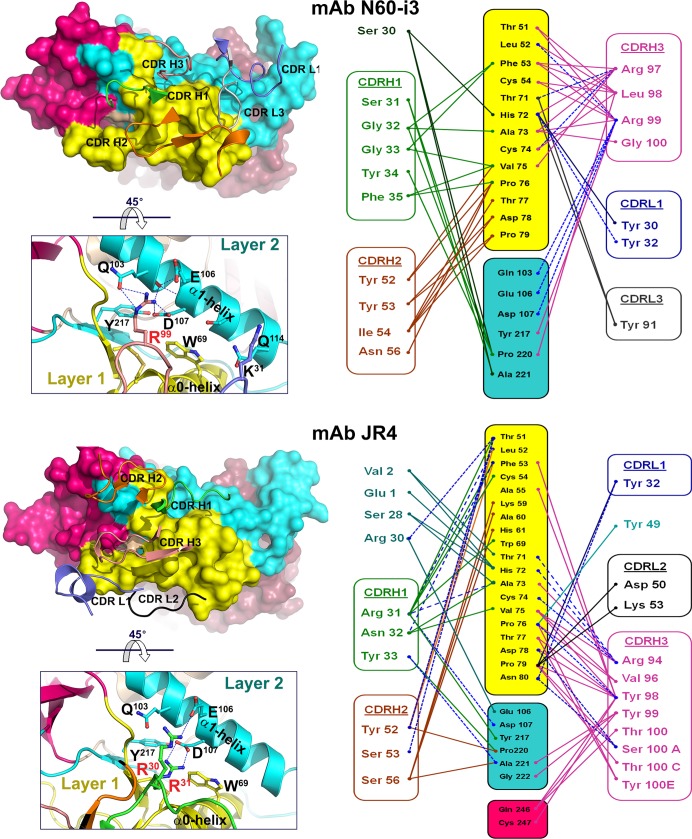
FIG 5.
Binding of MAbs N60-i3 and JR4 to gp120 antigen. On the left, the N60-i3 Fab-gp12093TH057 coree and the JR4 Fab-gp12093TH057 coree interfaces are shown with the molecular surfaces displayed at the gp120 molecules and with CDRs of Fabs shown as ribbons. Only CDRs contributing to the binding are shown. The 45° rotations show close-up views of the binding interfaces of Fabs and the α1-helix of layer 2. H bonds are shown as dashes in blue. Colors are as defined in the legend of Fig. 4. On the right, networks of interactions formed between Fabs and gp120 antigen as defined by a 5-Å distance criterion cutoff are shown as solid lines. H bonds are shown as dashes in blue.

