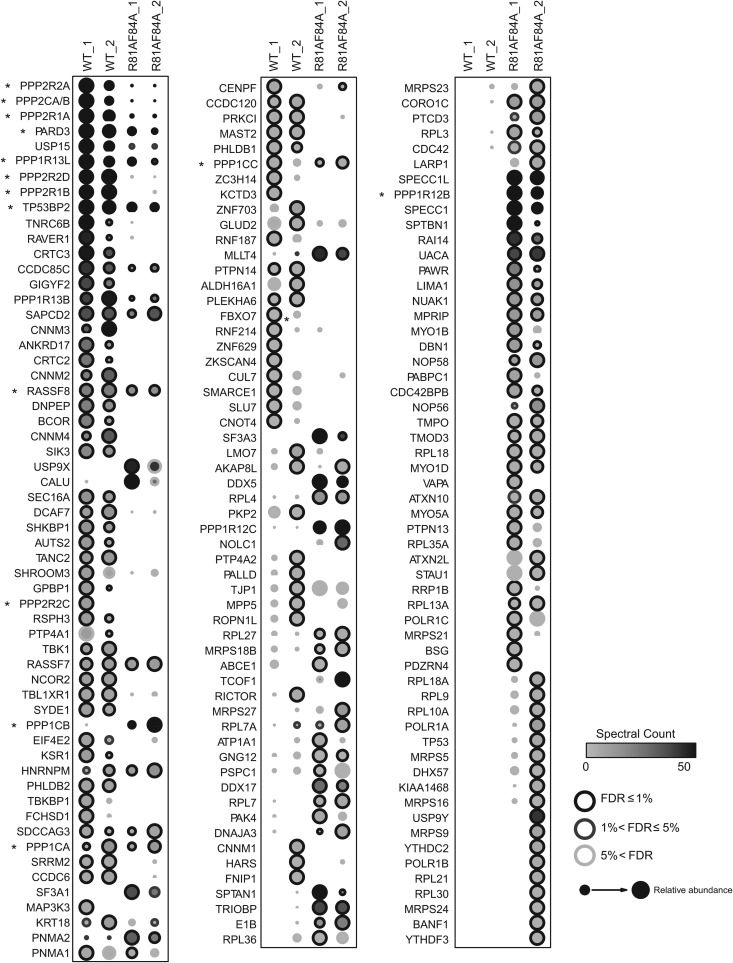
FIG 1.
High-confidence interaction partners for wild-type and class I mutant E4orf4. Comparison of AP-MS results for FLAG-E4orf4 and FLAG-E4orf4-R81A/F84A. Briefly, two biological replicates of human Flp-In T-REx 293 cells stably expressing FLAG-E4orf4 or FLAG-E4orf4-R81A/F84A were harvested in parallel to four negative controls (FLAG alone), and proteins were purified on anti-FLAG beads prior to analysis by liquid chromatography coupled to tandem mass spectrometry. Statistical analysis was employed to score high-confidence interactors, based on a false discovery rate (FDR) estimation, and proteins detected with ≤1% FDR either the wild-type or the mutant purifications are displayed (confidence values are mapped as the circle contour color in bins ≤1%, ≤5%, or >5% across both baits). Circle shading indicates the number of spectra detected (averages) across both biological replicate purifications (this value is capped at 50 spectra; the highest spectral count was 1,086). Circle size is proportional to the relative abundance of each prey across both baits; note, however, that the mutant protein was expressed at much lower levels than the wild-type protein in the stable cell lines used for AP-MS. Results from two studies, each with two biological replicates performed 8 months apart, are shown (denoted “_1” and “_2”). Asterisks denote genes that are discussed in more detail.

