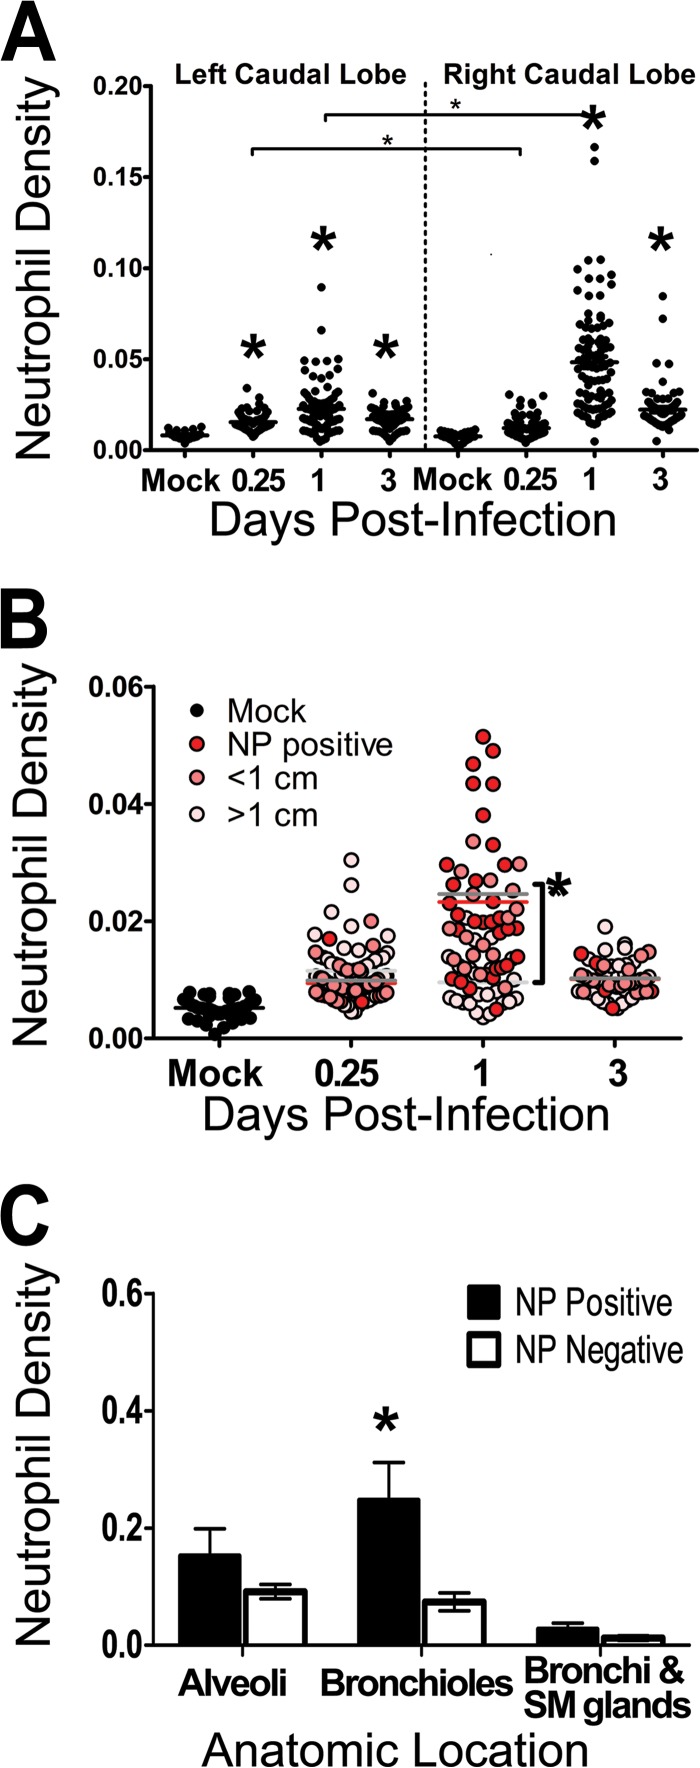
FIG 5.
Neutrophils in the lungs of ferrets after infection with influenza A virus (H1N1pdm). Ferrets were infected with 106 TCID50s of an H1N1pdm virus isolate (A/KY/180/2010), and lung tissues were taken upon euthanasia and were processed for histology. Caudal lung lobes, taken from two infected ferrets per day (0.25, 1, and 3 dpi), were systematically divided and were prepared for histology. Neutrophils in sections histochemically stained with NACE were quantified by using image analysis software, and data are expressed as the neutrophil density (the number of neutrophil-positive pixels per total tissue pixels on each image). (A) Neutrophil density was quantified over time. Data are divided by lobe. Large asterisks indicate significant differences from mock-infected animals, and significant differences between lobes are indicated by bars with small asterisks above them (P < 0.05 by nonparametric statistical tests). (B) Influenza virus nucleoprotein (NP) was identified on histological sections by IHC. The neutrophil density was calculated from serial NACE-stained sections; data were grouped according to distance from known NP-positive cells; and sites of IAV-positive cells were matched to distant sites within the same ferret (red, pink, and light-pink dots indicate NP-positive sites and sites <1 cm and >1 cm from NP-positive sites, respectively) and to sites in mock-infected animals (black dots). Data are plotted over time, and means at a given time point are indicated by lines colored according to distance (red, medium-gray, and light-gray lines for NP-positive sites and sites <1 cm and >1 cm from NP-positive sites, respectively). The asterisk indicates a significant difference between sites at a given time point. (C) Neutrophil density was calculated from pictures taken at sites of known influenza virus infection (NP positive), and data were grouped by anatomic region (alveoli, bronchioles, and bronchi with submucosal [SM] glands). These images were site-matched within the same ferret (<1 cm from known IAV-positive sites) to anatomic regions that had no IAV-positive cells (NP negative). Note that NP-positive cells at alveolar sites were leukocytes and that data for mock-infected animals are not shown on this panel but are shown in panels A and B. Asterisks indicate significant differences between NP-positive and NP-negative sites.

