FIG 4.
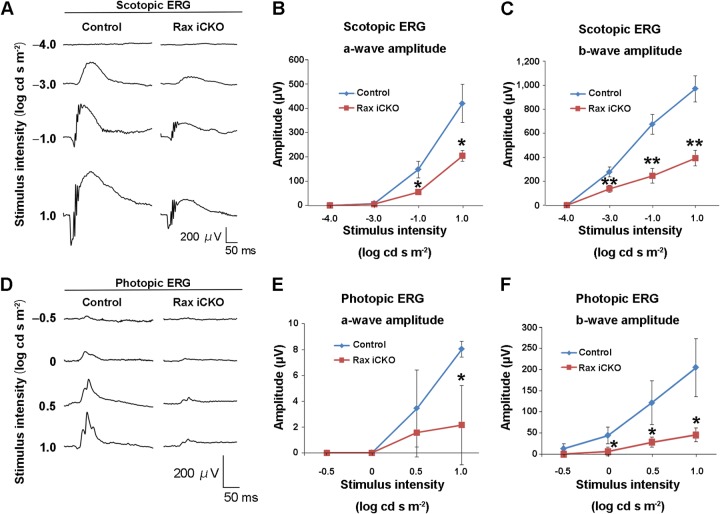
ERG analysis of Rax iCKO and control mice. (A to F) ERGs from Rax iCKO (P4 → 2 months) mice were recorded. (A) Scotopic ERGs elicited by four different stimulus intensities are shown. (B and C) The amplitudes of the scotopic ERG a-wave (B) and the b-wave (C) are shown as a function of the stimulus intensity. (D) Photopic ERGs elicited by four different stimulus intensities are shown. (E and F) The amplitudes of the photopic ERG a-wave (E) and b-wave (F) are shown as a function of the stimulus intensity. Data are means ± SDs (n = 3). **, P < 0.01 by Student's t test; *, P < 0.05 by Student's t test.

