FIG 7.
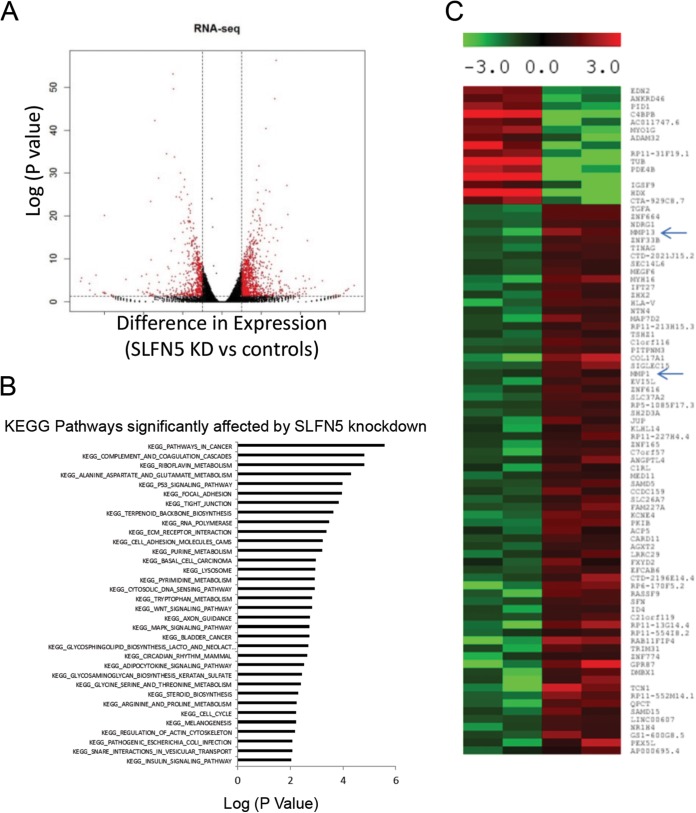
RNA-seq analysis of SLFN5 knockdown (KD). (A) Differential gene expression in 786-0 cells in which SLFN5 was knocked down compared to controls, based on RNA-seq analysis. Genes labeled in red are significantly differentially expressed (>log2 difference with a P value of <0.05). (B) KEGG pathway analysis of differentially expressed genes is shown. (C) Heat map of top differentially expressed genes is shown. MMP-1 and MMP-13 are indicated by arrows.

