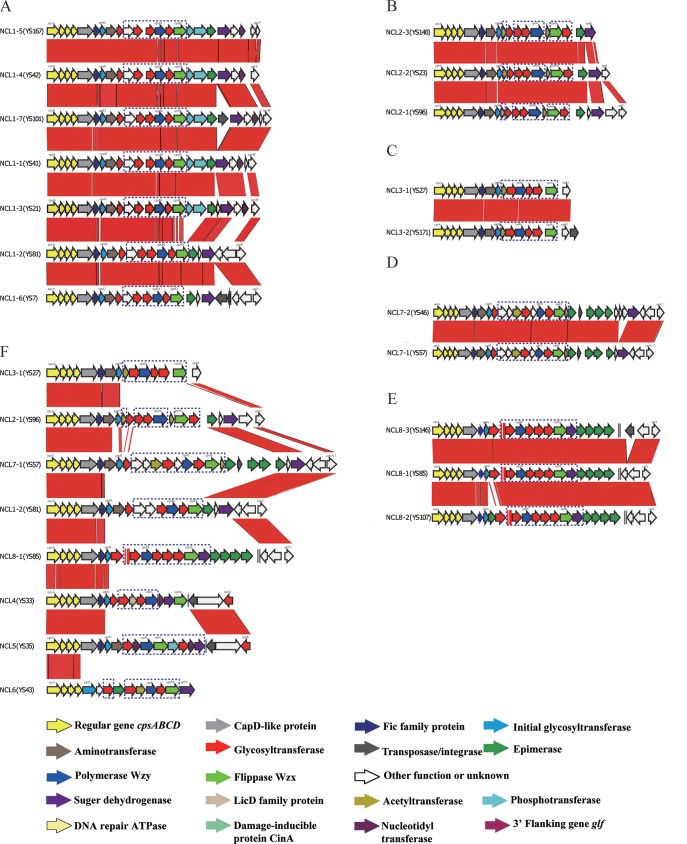
FIG 1.
Comparison of the cps loci within NCL1 (A), NCL2 (B), NCL3 (C), NCL7 (D), NCL8 (E), and 8 NCLs (F). Each colored arrow represents the gene whose predicted function is identified at the bottom. The names of the first and last genes, initial transferase genes, and the wzx and wzy genes of each NCL are appended to the corresponding arrows. NCL-specific genes are indicated by dotted blue lines. The red bars in each panel indicate regions conserved among strains. The glf gene is located on the 3′ side of each locus and is not marked.

