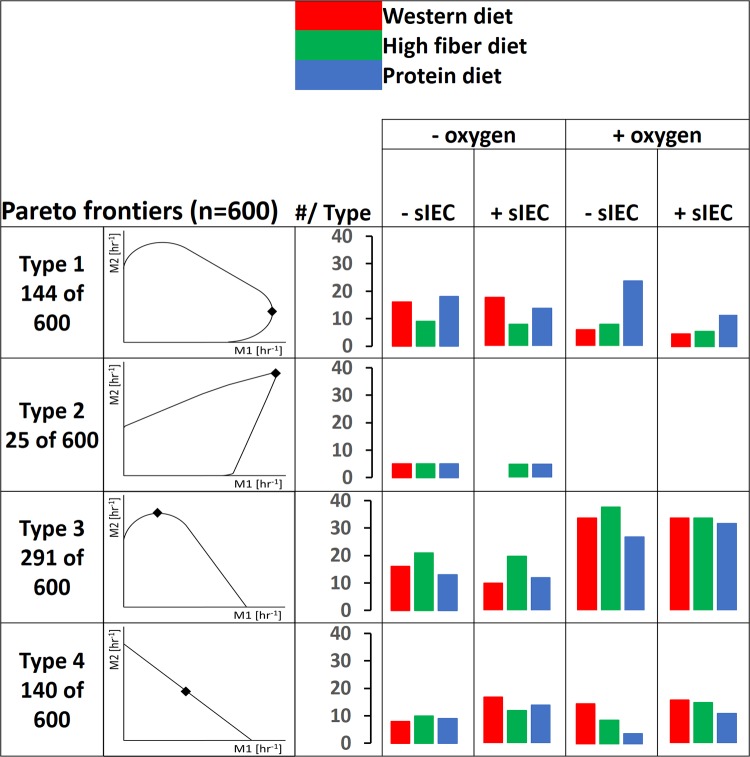
FIG 3.
The four types of Pareto frontiers computed when predicting microbe-microbe growth trade-offs and the number of pairs falling into each type for all models, resolved by scenario. M1, microbe 1; M2, microbe 2. Points on the Pareto frontiers where total growth is maximal are indicated by diamonds. The locations of these points differ for the individual microbe-microbe plots (and are shown in detail in Fig. S1 in the supplemental material). Note that the figure displays extreme cases for types 3 and 4, in which the growth benefit is 0%.

