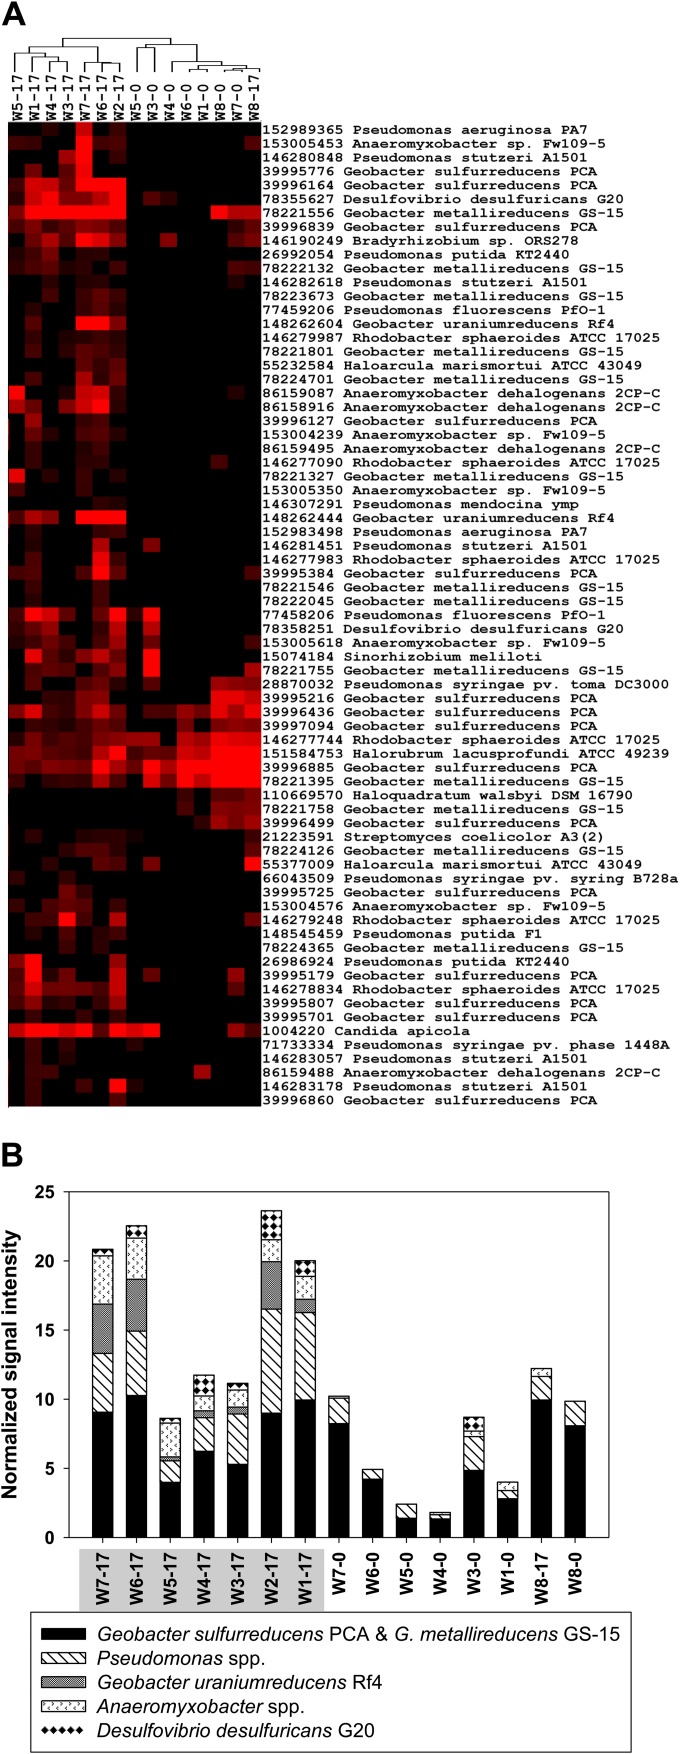
FIG 3.
(A) Two distinct major clusters, with the right cluster showing cytochrome c3 genes detected before EVO amendment (day 0) and in the upgra dient control well (W8) and the left cluster showing enrichment of the genes in the seven downgradient wells (W1 to W7) 17 days after the amendment. In the sample identification, the number following the dash is 0 for day 0 samples (we lost the day 0 sample from W2) and is 17 for day 17 samples. Results were generated in Cluster3.0 and visualized using TreeView. Black indicates signal intensities below background, while red indicates signal intensities above background and brighter red indicates higher signal intensities. (B) Signal intensity of cytochrome c3 genes derived from U(VI)-reducing species. The samples highlighted in gray represent the enriched cluster (left). Anaeromyxobacter spp. include A. dehalogenans 2CP-C and Anaeromyxobacter sp. Fw109-5. Pseudomonas spp. include primarily P. putida KT2440, P. stutzeri A1501, P. syringae, P. fluorescens, and P. aeruginosa PA7. The time-series dynamics and SE and P values are shown in Fig. S9 and S10 in the supplemental material. Other detected cytochrome-containing genera include Rhodobacter, Haloarcula, Sinorhizobium, Halorubrum, and Candida.

