Fig. 1.

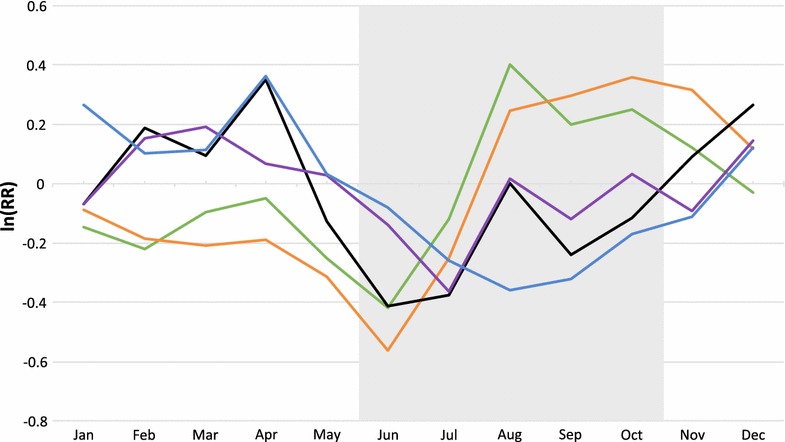
Relative effect of month of death by age group, Nouna HDSS 1998–2007. Infants <1 (green), children 1–4 (orange), adolescents 5–14 (black), adults 15–59 (purple), elderly 60+ (blue), grey shaded area (rainy season).

Relative effect of month of death by age group, Nouna HDSS 1998–2007. Infants <1 (green), children 1–4 (orange), adolescents 5–14 (black), adults 15–59 (purple), elderly 60+ (blue), grey shaded area (rainy season).