
FIG 2.
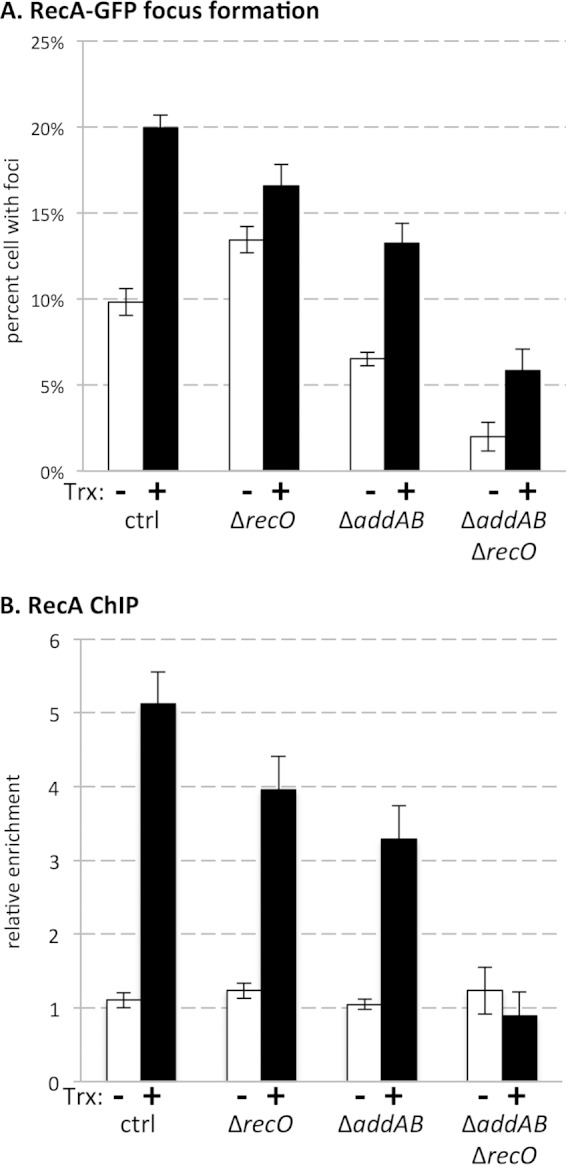
(A) RecA-GFP focus formation was quantified by microscopy in the absence (−) and presence (+) of transcription (Trx) of the Pxis-lacZ gene. (B) Relative association of RecA with the head-on gene-containing region was measured by ChIP-qPCR in the absence and presence of transcription of the Pxis-lacZ gene. Data shown represent averages from 6 to 16 biological replicates. Error bars represent standard error of the mean.