
TABLE 2.
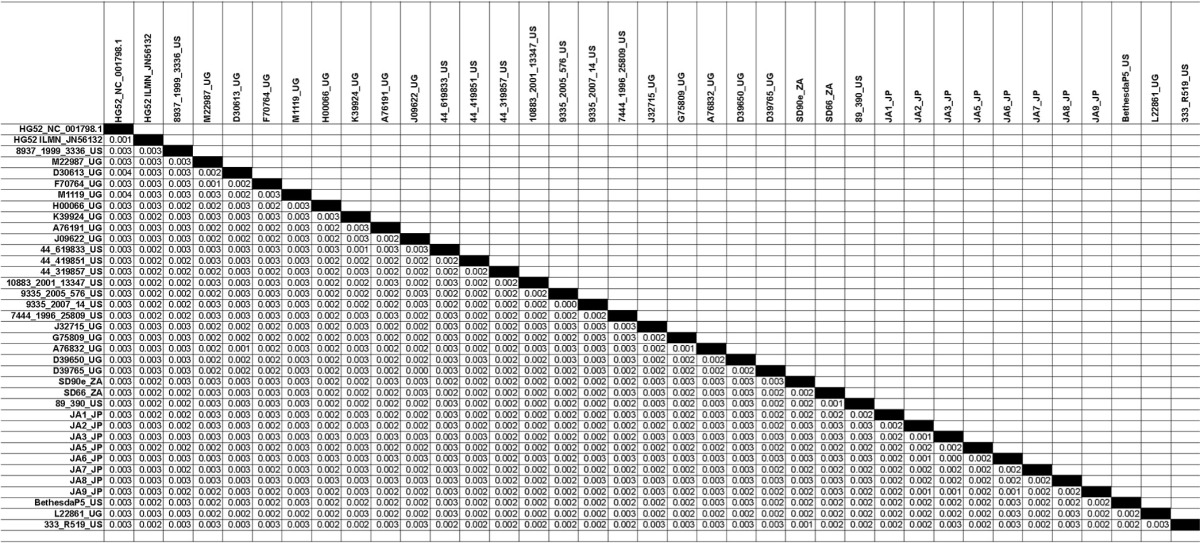
Estimates of evolutionary divergence between HSV-2 genome sequencesa
a
The numbers of base substitutions per site between sequences are shown. Analyses were conducted using the Maximum Composite Likelihood model (30). The analysis involved 37 nucleotide sequences. All positions containing gaps and missing data were eliminated. There were a total of 148,894 positions in the final data set. Evolutionary analyses were conducted in MEGA5 (24).