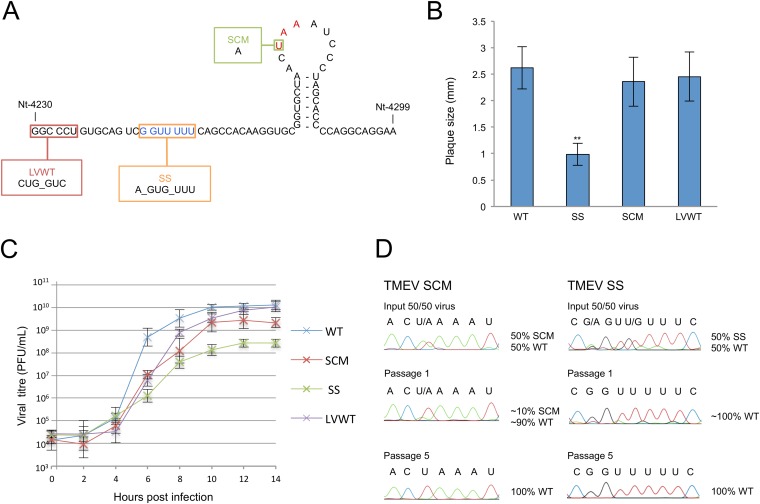
FIG 2.
Analysis of TMEV mutants. (A) Schematic representation of mutations. SS, shift site mutant; SCM, 2B* extension mutant; LVWT, StopGo mutant. The shift site sequence is in blue, and the 2B* stop codon is in red. (B) Mean plaque sizes for TMEV WT and mutant viruses. Mean plaque sizes are the averages for 100 representative plaques; error bars indicate standard deviations. **, SS is significantly different from WT (two-tailed t test, P < 0.001). (C) One-step growth curves. BHK-21 cells were infected with WT, SS, SCM, or LVWT viruses at an MOI of 10 and harvested at the indicated time points. Titers were measured by plaque assay. At least two biological repeats were performed for each virus; error bars indicate standard deviations. (D) Competition assay. BHK-21 cells were infected with a mixture of an MOI of 0.1 of either SS plus WT or SCM plus WT viruses. At 24 h p.i., virus was harvested and used to reinfect BHK-21 cells. Passaging was repeated five times. RNA was extracted from passages 0, 1, and 5, and a region of ∼1,000 nt encompassing the mutated region was sequenced.

