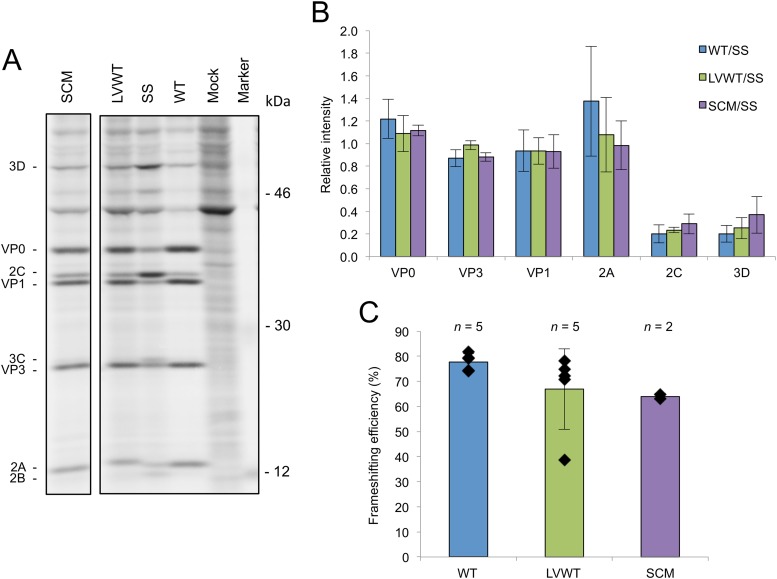
FIG 3.
Analysis of frameshifting in the viral context. (A) Radiolabeled TMEV translation products. BHK-21 cells were infected with either WT, SCM, SS, or LVWT viruses at an MOI of 8 or mock infected. Cells were labeled from 6 to 7 h p.i. and harvested at 7 h p.i., and proteins were separated by SDS-PAGE. Note that the more slowly migrating 2A band for LVWT may contain both 2A-2B* and a 2A-2B cleavage product. All samples were run on the same gel; an irrelevant lane has been excised. (B) Relative amounts of TMEV proteins. Individual band intensities for WT, LVWT, and SCM were normalized first by methionine content, then by the means of these values for VP0, VP1, and VP3 (to control for lane loading), and then by the corresponding similarly normalized band for SS. Each bar represents the mean (± standard deviation) from all biological repeats in which the corresponding band could be resolved and quantified (see the text). (C) Frameshifting efficiency. The intensity in each of the VP0, VP3, VP1, and 2C bands for WT, LVWT, and SCM viruses was normalized first by methionine content, then by the means of these values for VP0, VP1, and VP3 (to control for lane loading), and then by the corresponding similarly normalized values for SS. Then the value for 2C (downstream product) was divided by the average of the values for VP0, VP3, and VP1 (upstream products). Subtracting this value from 1 and multiplying the result by 100 gives the percent frameshifting efficiency. Each bar represents the mean value (± standard deviation) from five, five, and two biological repeats for WT, LVWT, and SCM viruses, respectively.

