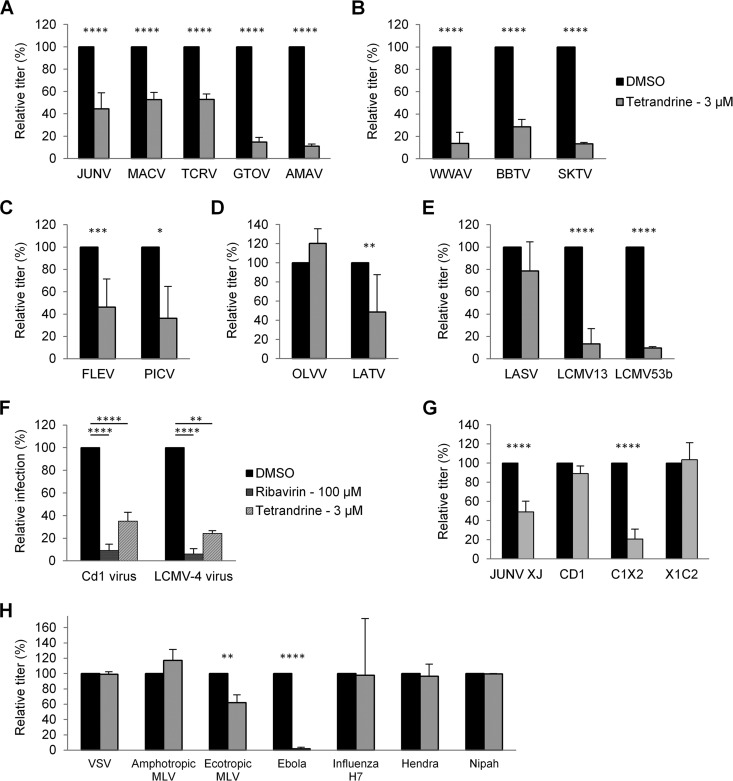
FIG 10.
Effects of tetrandrine. (A to E, G, and H) 293A cells (or NIH 3T3 cells for ecotropic MLV) were incubated with pseudotyped lentiviral or retroviral vectors expressing fusion proteins from arenavirus NW clade B (A); NW recombinant clade A/B (B); NW clade A (C); NW clade C (D); OW arenaviruses (E); JUNV, Cd1, or chimeras (G); and fusion proteins from other virus families (H). Cells were treated with DMSO or tetrandrine, and relative titers are shown as percentages of the control titer (DMSO treated). Mean titers (in TU per milliliter) on DMSO-treated cells were as follows: 2.7 × 10⁵ for JUNV, 5.0 × 10⁴ for MACV, 1.1 × 10⁵ for TCRV, 5.5 × 10⁴ for GTOV, 5.6 × 10⁴ for AMAV, 8.1 × 10³ for WWAV, 8.2 × 10³ for BBTV, 8.8 × 10³ for SKTV, 7.5 × 10³ for FLEV, 3.4 × 10⁵ for PICV, 3.9 × 10⁴ for OLVV, 7.5 × 10³ for LATV, 2.1 × 10⁶ for LASV, 4.0 × 10⁵ for LCMV13, 3.3 × 10⁵ for LCMV53b, 8.4 × 10⁴ for JUNV XJ, 7.9 × 10³ for Cd1, 1.7 × 10⁴ for C1X2, 8.2 × 103 for X1C2, 1 × 10⁶ for VSV, 3.7 × 10⁴ for amphotropic MLV, 8.2 × 10⁴ for ecotropic MLV, 4.7 × 10⁴ for Ebola virus, 1.9 × 10³ for influenza virus, 2.8 × 10⁴ for Hendra virus, and 3.4 × 10⁵ for Nipah virus. All data are the means ± standard deviations of results from 2 to 4 independent experiments. (F) Quantitation of Cd1 and LCMV-4 infection (number of foci) of Vero E6 cells treated with DMSO alone, ribavirin, or tetrandrine. Mean titers on DMSO-treated cells were 1 × 10⁴ FFU/ml and 2.3 × 10⁴ FFU/ml for Cd1 and LCMV, respectively. All data are the means ± standard deviations of results from 2 to 7 independent experiments. Statistical significance compared to the DMSO control is indicated (*, P < 0.05; **, P < 0.01; ***, P < 0.001; ****, P < 0.0001).

