FIG 2.
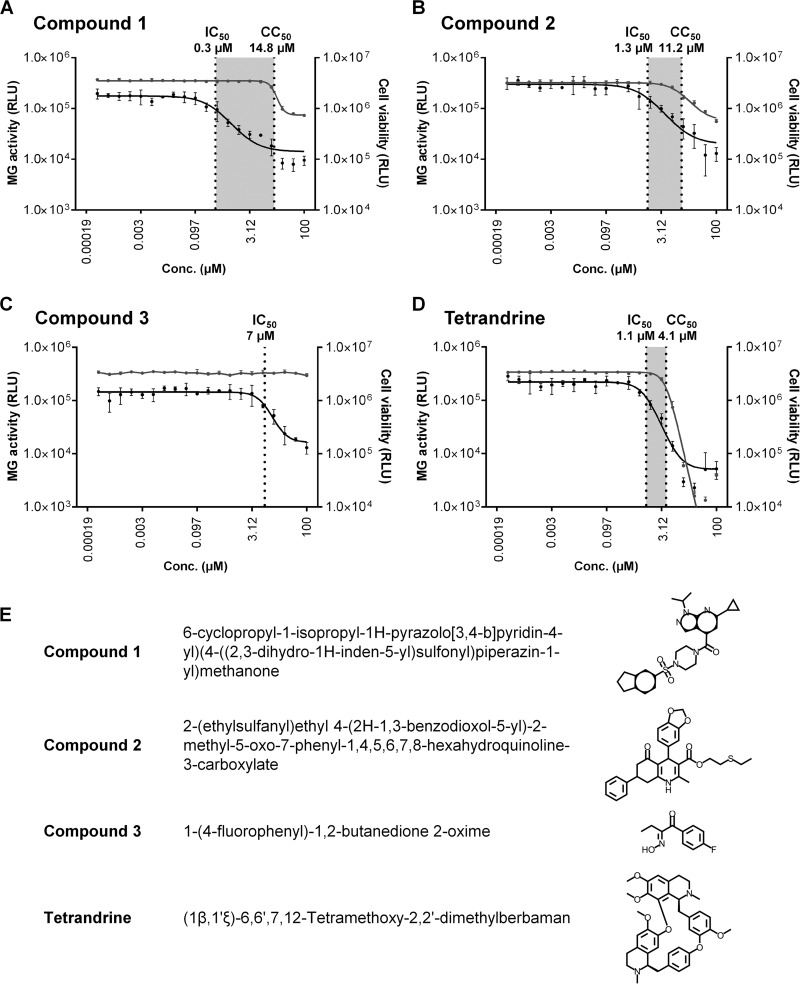
(A to D) IC50 and CC50 plots. Dose-response curves for each compound show MG rescue activity (GLuc activity in supernatants) (plotted on the left y axis with black circles and lines) and cell viability (luminescence in cell lysates) (plotted on the right y axis with gray circles and lines). IC50 and CC50 values are indicated by vertical dotted lines, with the shaded area between these values representing the selectivity index values, which are 49.3, 8.6, and 3.5, for compound 1 (A), compound 2 (B), and tetrandrine (D), respectively. For compound 3 (C), no toxicity occurred, even at the maximum assay dose of 100 μM, so the CC50 and SI were not calculated. Each graph point is the mean of data from three replicates ± standard deviations, joined by a fitted curve. RLU, relative light units. (E) Compounds 1 to 3 and tetrandrine. IUPAC names and structures are shown.

