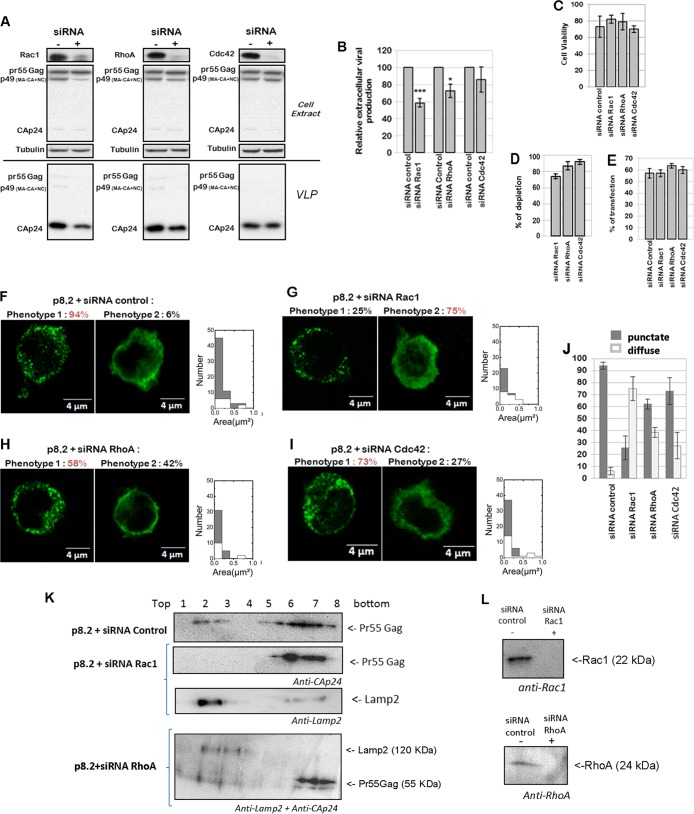
FIG 1.
Effect of Rho GTPase depletion on VLP production, Gag intracellular localization, and Gag membrane attachment in T cells. (A to E) Effect of Rac1, RhoA, and Cdc42 depletion on VLP production. Jurkat T cells were transfected with p8.2 (expression of Gag, Gag-Pol, and accessory viral proteins) and with the siRNA control or siRNA against Rac1, RhoA, or Cdc42. (A) Immunoblot analysis for detection of the HIV-1 proteins pr55Gag and CAp24 in cell lysates and in VLPs. Tubulin was used as a loading control. (B) Extracellular virus production measured by quantification of immunoblot images, i.e., the ratio between extracellular CAp24 and intracellular Pr55 Gag + CAp24. Bars show mean values and standard deviations resulting from three independent experiments. The statistical significances of differences were calculated by an unpaired t test. **, P value of <0.01; *, P value of <0.05. (C) Cell viability measured by flow cytometry analysis. (D) Quantification of Rho GTPase depletion after siRNA treatment. (E) Percent transfection measured by flow cytometry analysis. Bars show mean values and standard deviations resulting from three independent experiments. (F to J) Effect of Rac1, RhoA, and Cdc42 depletion on Gag intracellular localization. Jurkat T cells were transfected with p8.2 and with the siRNA control (F), siRNA against Rac1 (G), siRNA against RhoA (H), or siRNA against Cdc42 (I). Cells were fixed at 48 h posttransfection, permeabilized, stained for HIV-1 Gag, and analyzed by confocal microscopy. (J) Percentage of cells with each phenotype, calculated for 50 cells. Bars show mean values and standard deviations resulting from three independent experiments. (K and L) Effect of Rac1 or RhoA depletion on Gag cell membrane attachment. Jurkat T cells were microporated with p8.2 and with the siRNA control or siRNA against Rac1 or against RhoA. Cells were then lysed, and the PNS was used for membrane flotation assays. Intracellular proteins of each gradient fraction were loaded onto an SDS-PAGE gel. (K) The viral Gag and Lamp2 proteins were then revealed by immunoblotting, as indicated. (L) Rac1 and RhoA depletion by siRNA knockdown, in the PNS, shown by anti-Rac1 and anti-RhoA immunoblots, respectively.

