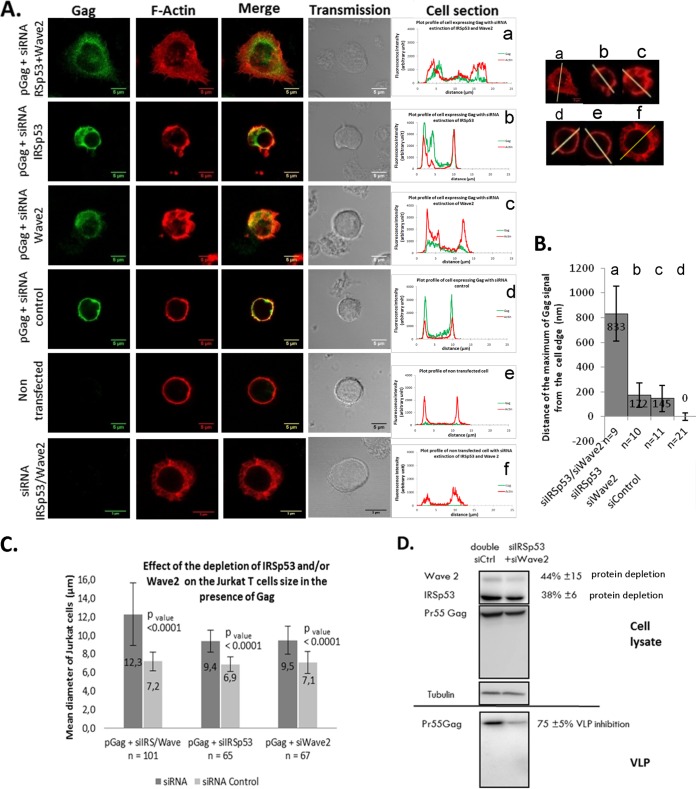
FIG 8.
Effect of a partial double knockdown of IRSp53/Wave2 by siRNA on HIV-1 Gag localization and VLP release in T cells. (A) Jurkat T cells were transfected with the vector pGag (HIV-1 Gag expression) (a to d) or pCMV-LacZ (control) (e and f), together with a mix of siRNA (Wave2 and IRSp53) (a and f) or a mix of control siRNAs (d). The cells were fixed and stained for F-actin (phalloidin-Alexa 546) (red) and Gag (anti-MAp17-Alexa 488) (green). Merge and transmission images are presented. The cell sections show Gag and F-actin fluorescent signals at the cell periphery. (B) Distance of the maximum Gag fluorescent signal from the cell edge (determined by the actin signal) under each condition (n = 9 to 21 cells). (C) Cell mean diameters (in micrometers) of the different cell transfection conditions, as indicated. The effect of the depletion of IRSp53 and/or Wave2 on Jurkat T-cell sizes compared to those of siRNA control-treated cells, in the presence of Gag, is shown. (D) Immunoblot analysis of pr55Gag in T-cell lysates and in VLPs. On the right are the average percentages of depletion of each protein and of inhibition of VLP release from three independent experiments. Tubulin was used as a loading control.

