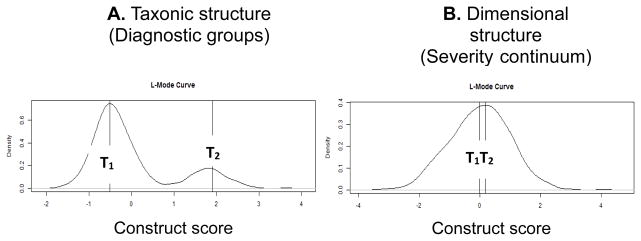
Figure 2.

An illustration of L-Mode analysis examining whether there is a categorical or continuous difference between two groups of individuals. These data result from a hypothetical simulation where the x-axis is the degree of a latent construct (e.g., headache severity) and the y-axis represents the density of the sample for each value of the construct. Figure 2A displays two modes representing two distinct taxons (T1 and T2) that are distinct entities or groups. Figure 2B displays two groups that do not show a clear categorical distinction such that they can be viewed as points along a continuum with T2 being more severe than T1. These two plots are extreme examples of evidence that would support a categorical (2A) or continuous (2B) interpretation of an underlying construct (e.g., headache severity).
