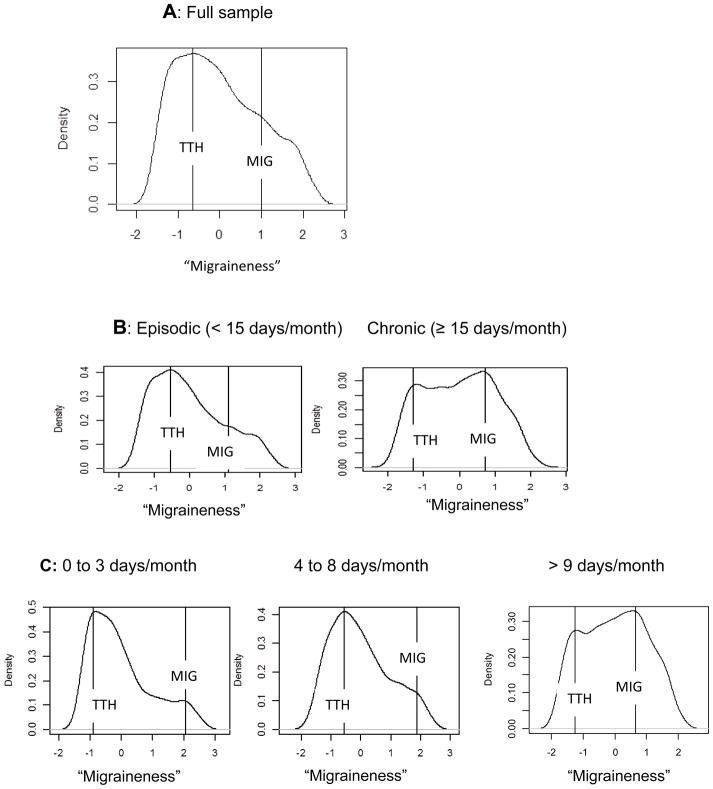
Figure 3.
An L-Mode analysis of examining whether there is a categorical or continuous difference between those who have tension-type headache and those who have migraine headache. The x-axis represents that degree of migraine symptoms (“migraineness”) with greater scores indicating greater degree of migraine-like symptoms. The complete sample is examined in row A. The sample is split into those who exhibit episodic headache (< 15 headaches/month; N = 2585) versus those with chronic headaches (≥ 15 headaches/month; N = 864) in row B. Finally, the sample is further split into tertiles with low frequency headache (< 4 headaches/month; N = 1135), mid frequency headaches (4 to 9 headaches/month; N = 1027), and high frequency headaches (> 9 headaches/month; N = 1287) in row C. Those individuals with Tension-Type Headache (TTH) are plotted in relation to those with Migraine (MIG).

