Figure 3.
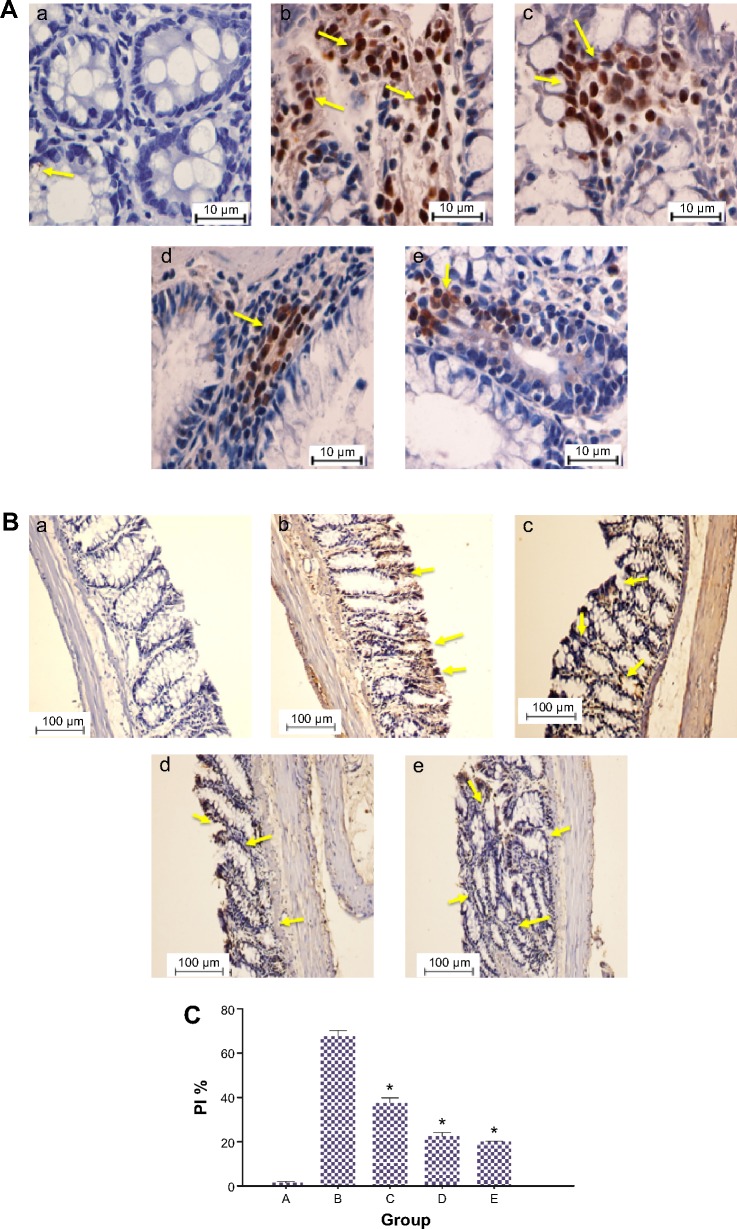
Immunohistochemical expression of PCNA in colon tissues of control and experimental groups of rats.
Notes: (A and B) (a) Group A. (b) Group B. (c) Group C. (d) Group D. (e) Group E. PCNA protein expression is illustrated as brown staining. (A) Scale bar: 10 µm. (B) Scale bar: 100 µm. (C) Quantitative data expressing the PCNA protein level illustrate that there was significant downregulation in groups C–E compared with the cancer control group. Data are shown as mean ± standard error of the mean (n=6). Values are statistically significant at *P<0.05. The five groups of rats were A: normal control; B: cancer control; C: low dose of DECPR; D: high dose of DECPR; and E: 5-fluorouracil treatment control. The yellow arrows show brown staining demonstrating a significant downregulation of PCNA in groups C–E compared with the cancer control group.
Abbreviations: DECPR, dichloromethane extract of Curcuma purpurascens rhizome; PI, proliferation index; PCNA, proliferating cell nuclear antigen.

