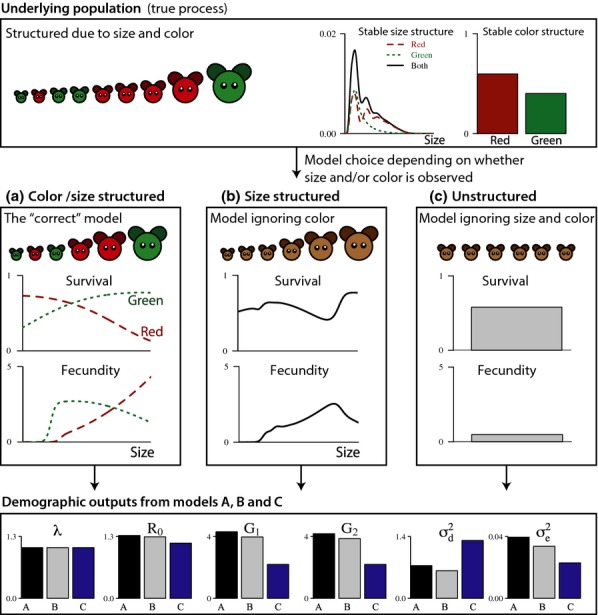
Figure 2.

An example of a size-structured population of red and green individuals. Depending on whether colour and size is recognised, the vital rates will look different to the observer, as illustrated for survival and fecundity in panels (a–c) (for transition rates, see the provided R code). As a result, with the exception of λ estimates of demographic outputs will be biased in models b and c. Consequences of underlying heterogeneity on estimates of extinction risk (through demographic and environmental variance) are provided in the supplementary R code.
