
Fig. 5.
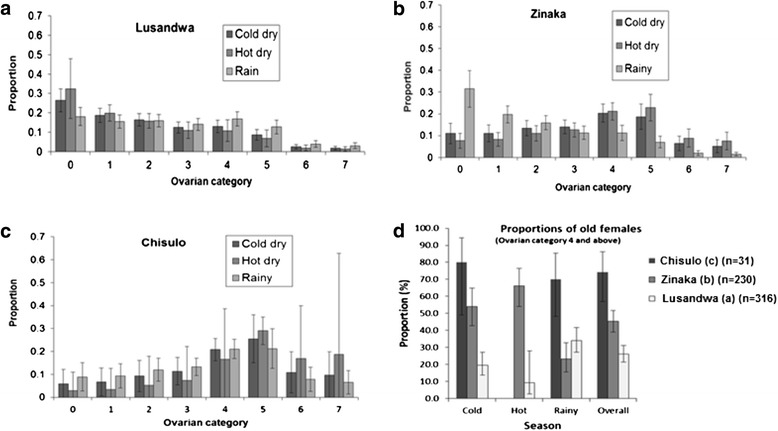
Seasonal proportions of female flies of various ovarian categories derived from the model. a Depicts right skew of proportions in all seasons; b Depicts right skew of proportions in the rainy season and left skew in the cold and hot dry season; c Depicts left skew of proportions in all seasons and d Depicts the similarity in pattern of increase between the proportion of old flies and degree of habitatfragmentation.